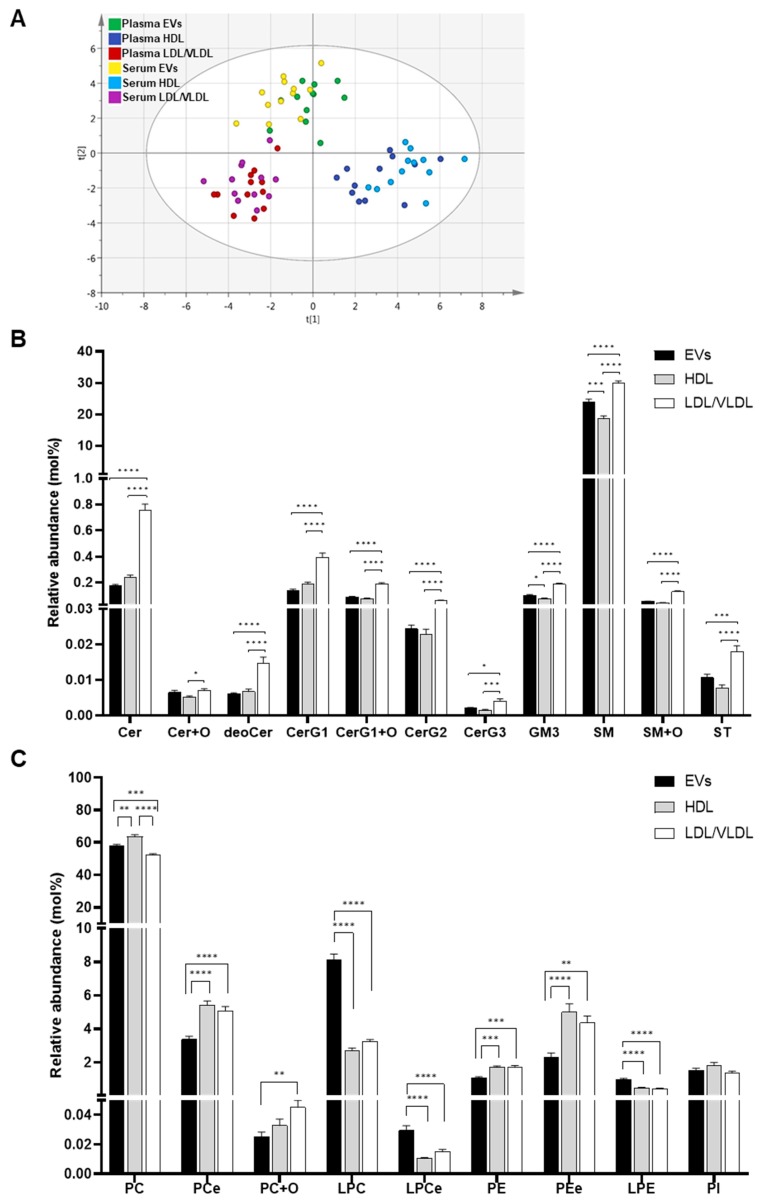
Figure 3.
Comparison of relative concentration (mol%) of lipid classes in EV, HDL and LDL/VLDL fractions. (A) Lipid profiles of EVs, HDL, and LDL/VLDL obtained from human plasma or serum (n = 12 per group) analyzed by PCA. Analysis was performed using relative concentration (mol%). The goodness of fit parameters R2X and Q2 were 0.537 and 0.422, respectively. Relative lipid concentration (mol%) of sphingolipids (B) and glycerophospholipids (C). Relative concentration of each lipid class in EVs (black bars), HDL (gray bars), and LDL/VLDL (white bars) isolated from plasma (n = 12 per group). Bar graph plotted using average mol% values of each lipid class. Error bars indicate standard errors. Statistical differences among the groups analyzed by one-way ANOVA followed by Tukey’s test. * p < 0.05, ** p < 0.01, *** p < 0.001, **** p < 0.0001.

