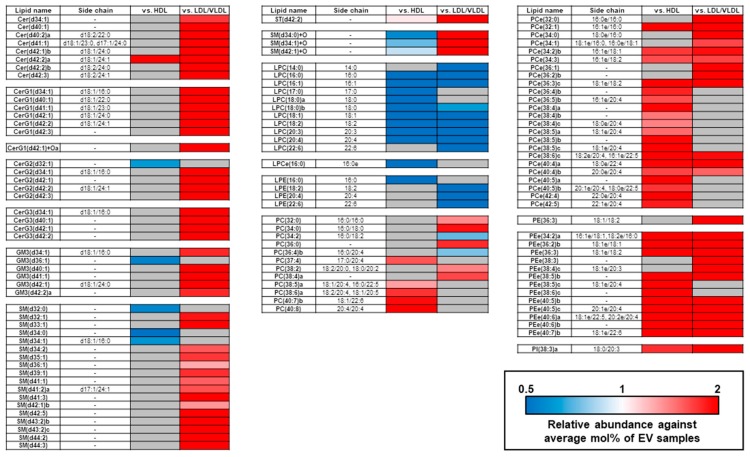
Figure 4.
Differentially expressed lipid molecules in plasma EV, HDL, and LDL/VLDL fractions. Heatmap of relative lipid molecule concentrations in plasma EVs, HDL, and LDL/VLDL (n = 12 per group). Average mol% of each lipid molecule in plasma EVs was set to 1. Only lipid molecules showing statistical significance (p < 1.89 × 10−4 = 0.05/264; Bonferroni correction; Student’s t-test) between EVs and each lipoprotein, were assigned to build the heatmap.

