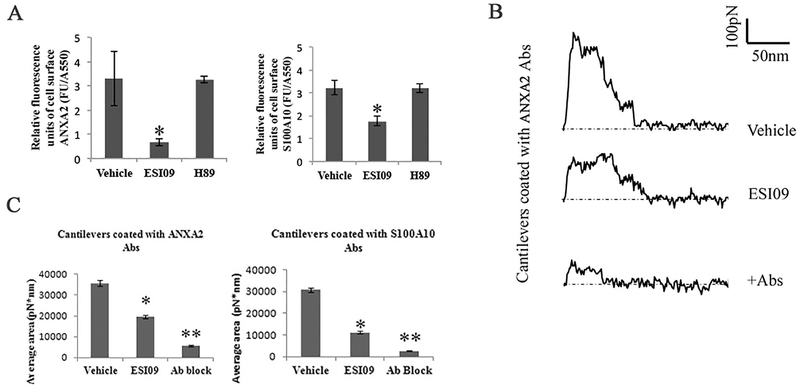
Fig. 5.
Inhibition of EPAC1 impedes ANXA2 and S100A10 residing on endothelial apical surfaces. An impermeable cell-based ELISA assay was employed to compare ANXA2 and S100A10 in ESI09 (5 μM, n = 12)-, H89 (10 μM, n = 12)-, and vehicle-only (n = 12) treated HUVECs (A). Compared with the vehicle-treated group, ESI09-treated HUVECs show lower relative fluorescence units corrected for cell protein (FU/A550) of ANXA2 and S100A10 (P < 0.05) signals on the surfaces of HUVECs. The data presented are representative of three independent experiments.
The unbinding work of cell surface antigens with a relevant antibody on a cantilever surface was quantified by force-distance curve-based atomic force microscopy (AFM) (representative curves in B). During static force mode spectroscopy as the cantilever is pulled up from the cell surface, the unbinding force reaches its peak before all antigen–antibody interactions rupture. These specific unbinding force measurements can be compiled for quantification of total ANXA2 or S100A10 expression on selected areas on the HUVEC cell surface (C). With ANXA2 or S100A10 antibody-coated cantilevers, the unbinding work of vehicle-treated HUVECs is higher than that of ESI09-treated HUVECs (*P < 0.05, *P < 0.01), indicating reduced cell surface ANXA2 and S100A10 expression after ESI09 treatment. Ab block: ANXA2 antibody and S100D10 antibody at 25 μg/ml for 30 min in medium, respectively, before the AFM measurement.

