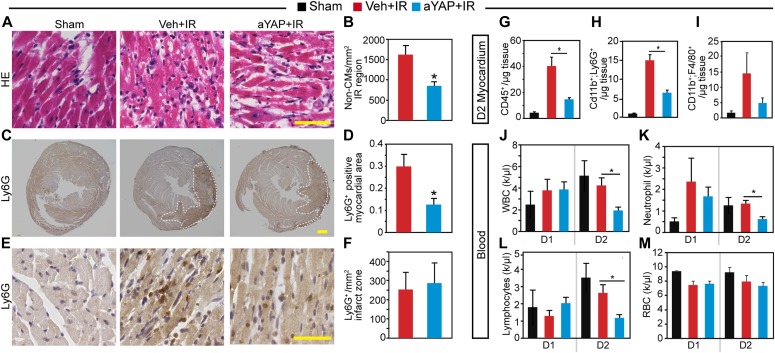
Figure 3. aYAP modRNA reduces cardiac inflammation after IR.
(A) Representative images of hematoxylin and eosinstained heart sections. In Veh+IR and aYAP+IR, typical images from the ischemia regions were shown. Bar = 50 µm. (B) Quantification of non-CMs in the infarct region. t test: *P < 0.05, n = 4. (C) Heart sections stained with Ly6G antibody, low magnification. White dotted lines indicate Ly6G+ myocardium. Bar = 500 µm. (D) Quantification of Ly6G+ myocardium. Ly6G+ myocardium area was normalized against the whole myocardium area. t test: *P < 0.05, n = 4. (E) High magnification of heart sections stained with Ly6G antibody. Images were taken from infarct zone. Bar = 50 µm. (F) Ly6G+ cell density in the infarct zone. (A, B, C, D, E, F) Heart sections from day 2 (D2) after IR were used. (G, H, I) Quantification of different myeloid lineage leukocytes. Myocardiums from D2 were dissociated and non-CMs were enriched. For flow cytometry analysis, non-CMs were stained with indicated antibodies. Myeloid lineage leukocytes were labeled with CD45 antibody. CD45+ cells were further separated into neutrophils (CD11b+; Ly6G+) and macrophages/monocytes (CD11b+; F4/80+). Cell number was normalized to the myocardium weight. One-way ANOVA post hoc tests. N = 4. *P < 0.05. (J, K, L, M) Peripheral blood cell composition at day 1 (D1) and day 2 (D2) after IR. Blood samples from affected mice were collected and analyzed on a HEMAVET 950FS auto blood analyzer. The counts of white blood cells, red blood cells, neutrophils, and lymphocytes were automatically analyzed. k/μl, 1,000 cells per microliter blood. Sham, n = 3. Veh+IR, n = 4; aYAP+IR. One-way ANOVA post hoc tests. *P < 0.05.

