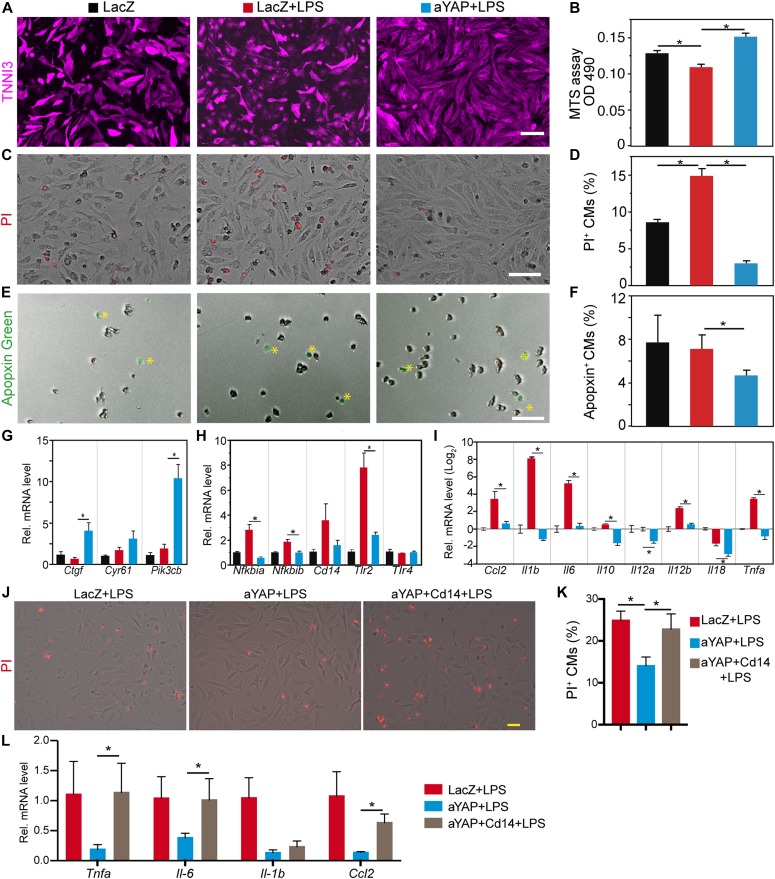
Figure 6. aYAP suppresses TLR4 signaling in vitro.
In the absence of serum, NRVMs were first treated with the indicated virus for 12 h, then 1 µg/ml LPS was added to activate TLR4 signaling. 24 h after LPS stimulation, NRVMs were collected for gene expression analysis or cell death studies. (A) Cell morphology after LPS and indicated adenovirus treatment. Cardiac troponin I (TNNI3) was used to label CMs. Bar = 100 µm. (B) Cell viability assay. Cells were treated with MTS solutions and OD 490 was measured according to manufacturer’s protocol (Promega). N = 6. (C, D) NRVM necrosis analysis. (C) Representative images of PI stained NRVMs. Bar = 100 µm. (D) Quantification of PI-positive CMs. N = 4. (E, F) NRVM apoptosis analysis. (E) CMs stained with Apopxin Green. Bar = 100 µm. (F) Quantification of Apopxin-positive CMs. N = 4. (G, H, I) NRVM gene expression analysis. (G) mRNA level of known YAP target genes. (H) mRNA level of crucial innate immune genes regulated by YAP. (I) mRNA level of selected cytokine/chemokine genes. N = 4. (J, K) NRVM necrosis analysis. (J) Representative images of PI stained NRVMs. Bar = 50 µm. (K) Quantification of PI-positive CMs. N = 4. (L) NRVM gene expression analysis. N = 4. (B, D, F, G, H, I, K, L) One-Way ANOVA Post Hoc Tests. *P < 0.05.

