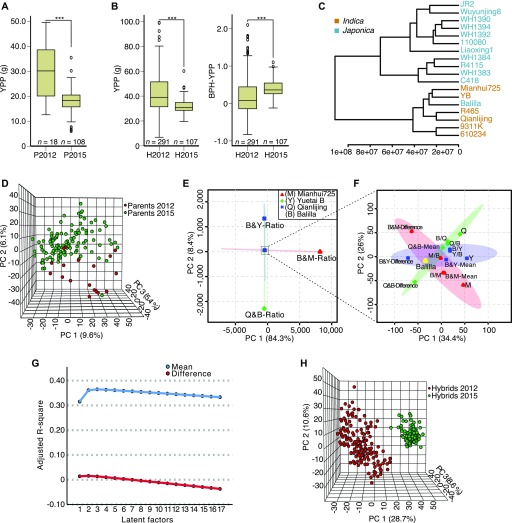
Figure 1. Determination of predictive variables for BPH-YPP.
(A) YPP of parents from Pop2012 and Pop2015. ***P = 2.7 × 10⁻⁴, two-tailed, independent-samples t test. (B) YPP and BPH-YPP of hybrids from Pop2012 and Pop2015. For YPP, ***P = 2.1 × 10⁻¹⁹, two-tailed, independent-samples t test. For BPH-YPP, ***P = 5.2 × 10⁻⁷, two-tailed, independent-samples t test. (C) Dendrogram of the 18 cultivars from Pop2012 based on the 3,746 detected metabolic analytes. (D) Three-dimensional distribution of parents from Pop2012 and Pop2015 based on PCA of the 3,746 detected analytes. (E, F) Distributions of three pairs of reciprocal hybrids and corresponding parents based on PCA of 3,746 metabolic analytes. The ratios of (E), means of, and differences in (F) parental metabolite levels were calculated and compared to hybrid metabolite profiles. Slashes indicate crosses between two parents, and female and male parents are on the left and right of the slash, respectively. Shadows with color are 95% confidence regions. (G) Changes in the number of latent factors and adjusted R-square values. PLS regression analysis was performed between the BPH-YPP of hybrids from Pop2012 and the means of/differences in parental metabolite profiles. No more than 17 latent factors were extracted in both analyses. (H) Three-dimensional distribution of hybrids from Pop2012 and Pop2015 based on PCA of the 3,746 predictive variables.

