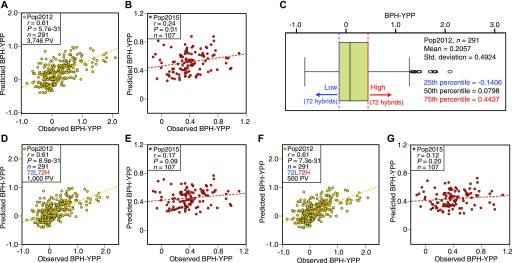
Figure 2. Prediction of BPH-YPP with predictive variables selected from PLS-DA.
(A) Prediction of BPH-YPP for Pop2012 with 3,746 predictive variables (PVs). (B) Prediction of BPH-YPP for Pop2015 based on the predictive model constructed in Fig 2A. (C) Box plot of BPH-YPP for Pop2012. Hybrids were divided into low- and high-BPH-YPP subgroups according to the 25th and 75th percentiles. (D) Prediction of BPH-YPP for Pop2012 with the top 1,000 predictive variables based on PLS-DA of 72 high- and 72 low-BPH-YPP hybrids. (E) Prediction of BPH-YPP for Pop2015 based on the predictive model constructed in Fig 2D. (F) Prediction of BPH-YPP for Pop2012 with the top 500 predictive variables based on PLS-DA of 72 high- and 72 low-BPH-YPP hybrids. (G) Prediction of BPH-YPP for Pop2015 based on the predictive model constructed in Fig 2F. The dotted lines are the fit lines.

