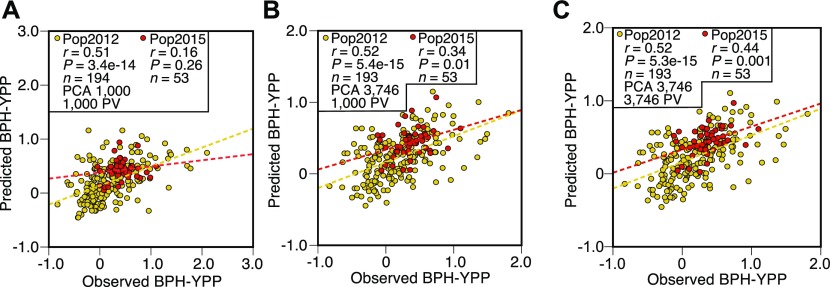
Figure 3. Dissection of population structure increases predictabilities.
(A) Prediction of BPH-YPP for Pop2012 and Pop2015 with the top 1,000 predictive variables used in Fig 2D and population structure determined by the top 1,000 predictive variables. (B) Prediction of BPH-YPP for Pop2012 and Pop2015 with the top 1,000 predictive variables used in Fig 2D and population structure determined by 3,746 predictive variables. (C) Prediction of BPH-YPP for Pop2012 and Pop2015 with 3,746 predictive variables and population structure determined by 3,746 predictive variables. The dotted lines are the fit lines.

