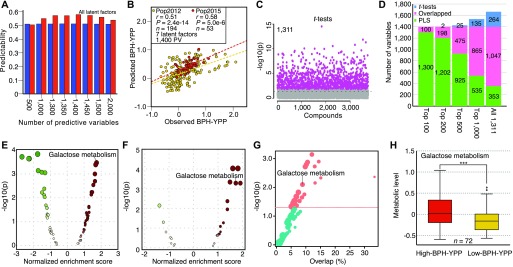
Figure 4. Feature selection for BPH-YPP.
(A) Predictabilities of BPH-YPP with different numbers of predictive variables selected according to mean VIP values of all seven latent factors. (B) Prediction of BPH-YPP for Pop2012 and Pop2015 with the top 1,400 predictive variables selected according to the mean VIP values of the seven latent factors. (C) Differential analytes between 72 high- and 72 low-BPH-YPP hybrids from Pop2012. Independent-samples t test, equal group variance assumed, adjusted P-value cutoff: 0.05. (D) Comparison of the 1,400 predictive variables used in Fig 4B (PLS) and differential analytes identified in Fig 4C (t tests). (E) Differential metabolic pathways between high- and low-BPH-YPP hybrids from Pop2012. (F) Differential metabolic pathways between high- and low-BPH-YPP hybrids from Pop2015. (G) Enriched metabolic pathways between high- and low-BPH-YPP hybrids from Pop2012 based on dysregulated metabolic pathway analysis with MetDNA. (H) Comparison of the average levels of metabolites involved in galactose metabolism between high- and low-BPH-YPP hybrids from Pop2012. ***P = 2.7 × 10⁻⁵, two-tailed, independent-samples t test.

