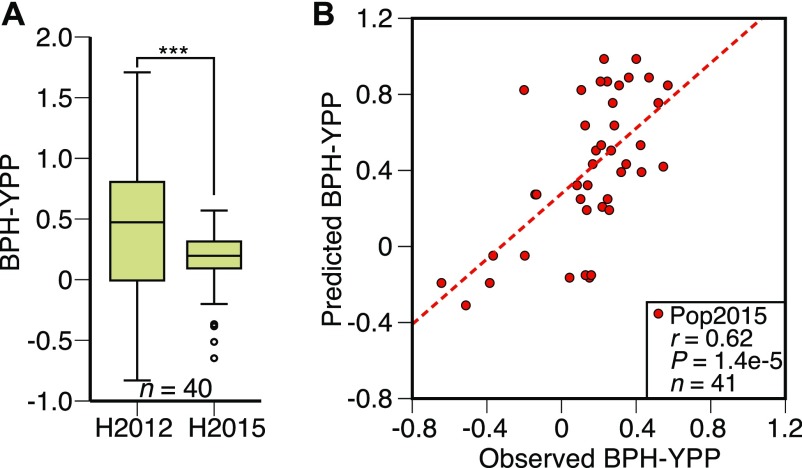
Figure 5. Validation of the predictive model.
(A) BPH-YPP of reciprocal hybrids phenotyped in 2012 and 2015. ***P = 4.5 × 10⁻⁴, two-tailed, paired-samples t test. (B) Prediction of BPH-YPP for 41 hybrids planted in 2015 according to the predictive model built in Fig 4B. The dotted line is the fit line.

