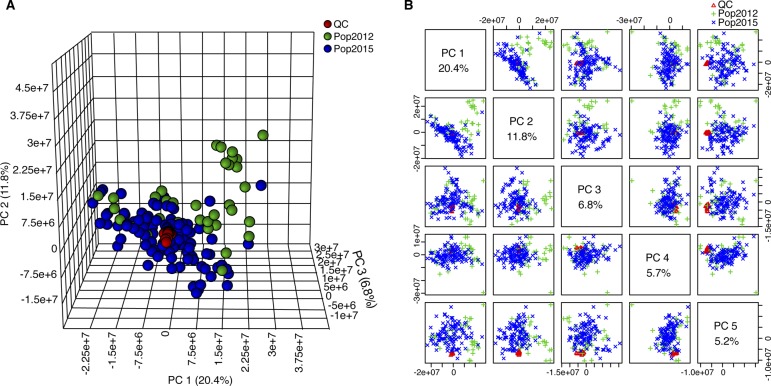
Figure S13. PCA score plots of quality control and experimental samples.
To check the accuracy of the obtained metabolomics data, a PCA was performed on both the quality control and experimental samples based on the unnormalized relative abundance of all detected analytes. (A, B) Score plots of the three-dimensional (A) and the top five principal components (B) showed the tight distribution of the quality control sample during the whole experimental process. Red, green, and blue colors represent the quality control (QC), samples for Pop2012, and samples from Pop2015, respectively.

