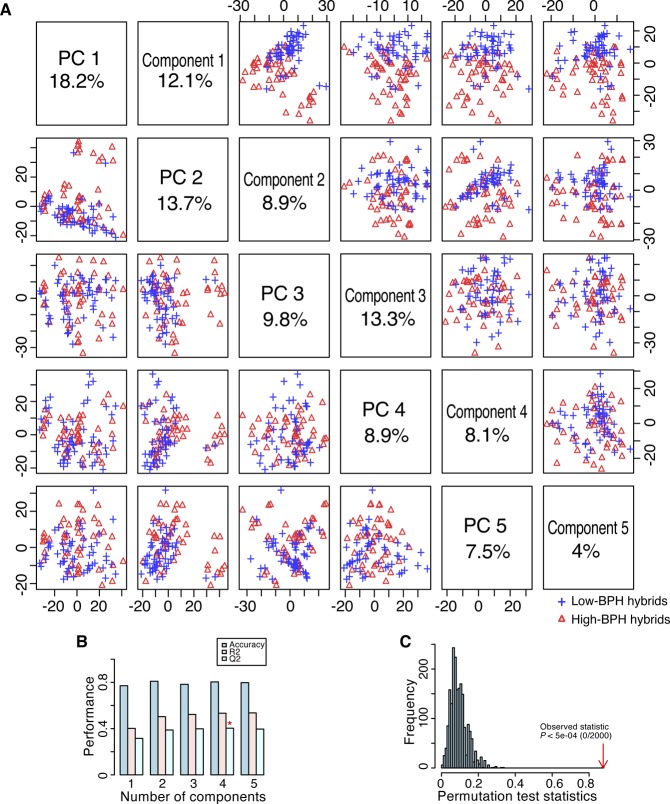
Figure S2. PCA and PLS-DA of 72 high- and 72 low-BPH-YPP hybrids from Pop2012.
(A) PCA and PLS-DA score plots of 72 high- and 72 low-BPH-YPP hybrids based on the 3,746 predictive analytes. (B) Cross-validation of PLS-DA. (C) Permutation testing of PLS-DA. BPH-YPP, better-parent heterosis for yield per plant; PC, principal component; PCA, principal component analysis; PLS-DA, partial least squares-discriminant analysis.

