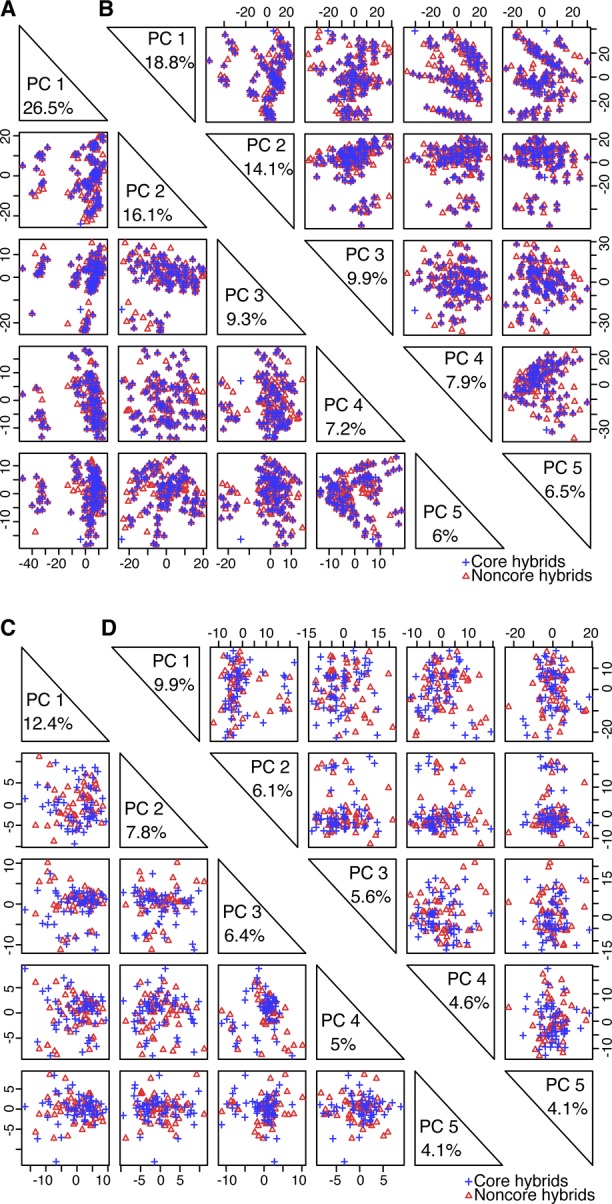
Figure S6. Distributions of core and noncore hybrids from both populations based on PCA of different numbers of predictive variables.

(A) Distribution of core and noncore hybrids from Pop2012 based on PCA of the top 1,000 predictive variables used in Fig 2D. (B) Distribution of core and noncore hybrids from Pop2012 based on PCA of 3,746 predictive variables. (C) Distribution of core and noncore hybrids from Pop2015 based on PCA of the top 1,000 predictive variables used in Fig 2D. (D) Distribution of core and noncore hybrids from Pop2015 based on PCA of 3,746 predictive variables. PC is short for principal component.
