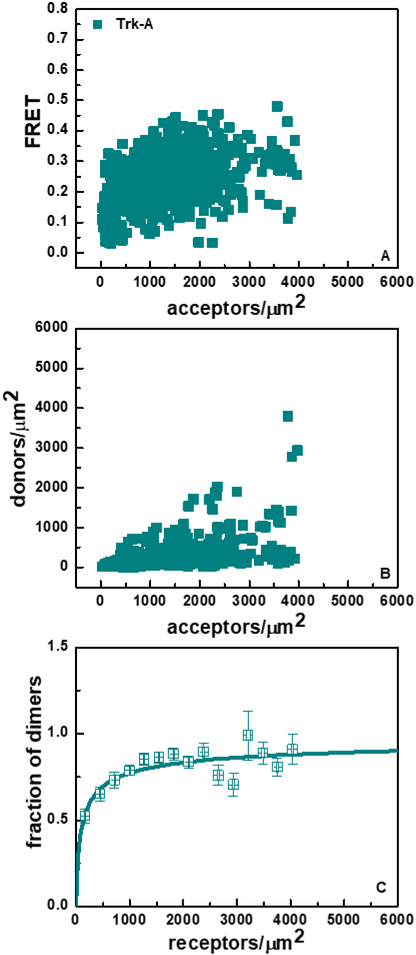
Figure 2.
FRET data for full-length Trk-A in the absence of ligand. (A) FRET efficiencies as a function of acceptor (Trk-A-eYFP) concentration. Every data point has different donor (Trk-A-mTurquoise) concentration. (B) Donor (Trk-A-mTurquoise) concentration, plotted as a function of acceptor (Trk-A-eYFP) concentration. (C) Fraction of Trk-A dimers as a function of total Trk-A concentration. The experimentally determined dimeric fractions are binned and are shown with the symbols, along with the standard errors. The solid line indicates the best-fit dimerization curve, plotted for the best-fit Kdiss shown in Table 1.

