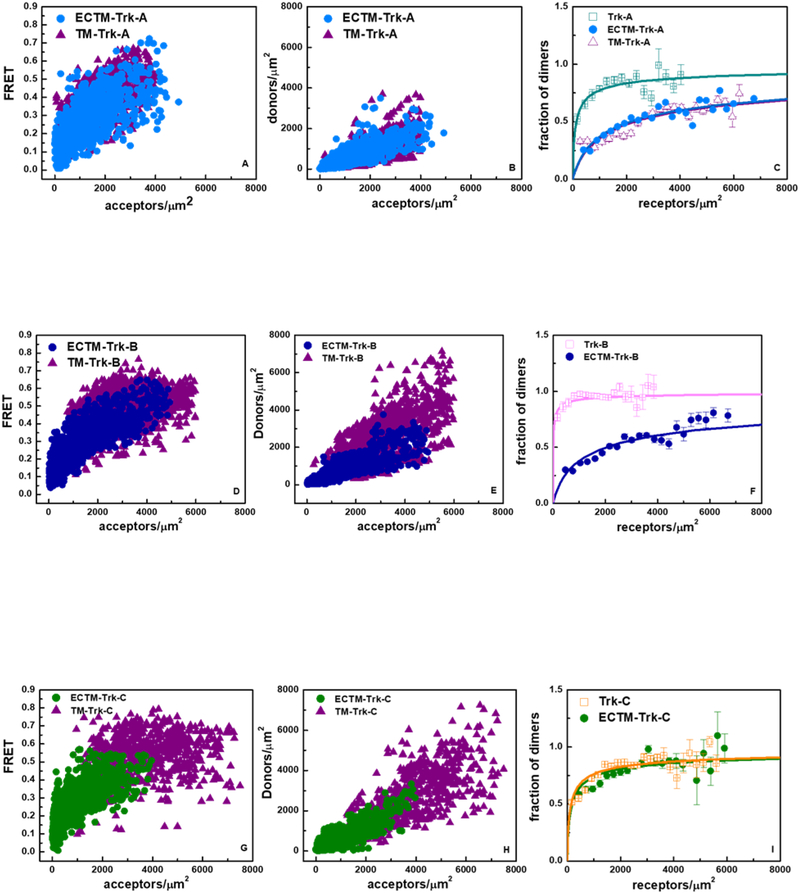
Figure 5.
FRET data for the ECTM Trk receptors, which lack IC domains, and for the TM Trk receptors, which lack both EC and IC domains. Data are collected in the absence of ligand. (A, D, and G) Measured FRET efficiencies as a function of receptor concentrations. (B, E, and H) Donor concentrations versus acceptors concentrations. (C, F, and I) Dimeric fractions as a function of total receptor concentrations. The experimentally determined dimeric fractions are binned and are shown with the symbols, along with the standard errors. The solid lines are the dimerization curves, plotted for the optimized dimerization parameters reported in Table 2. The FRET data for the TM Trk-B and Trk-C constructs could not be fitted with a dimer model.

