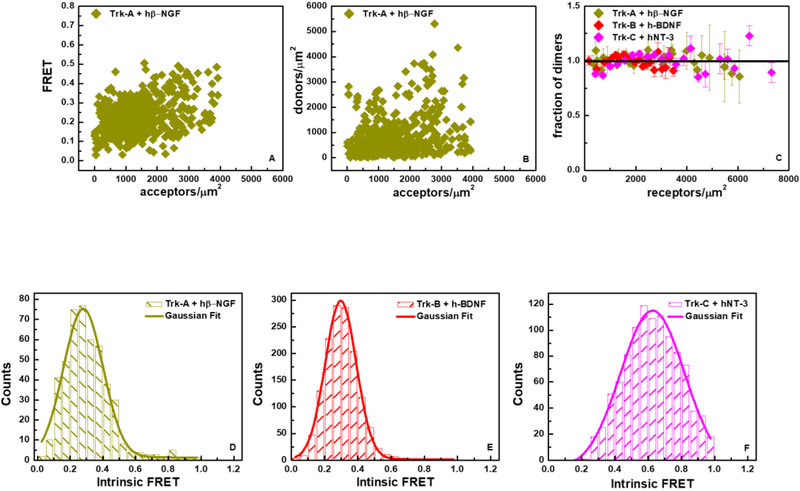
Figure 6.
FRET data for full-length Trk receptors in the presence of ligand at saturating concentration. (A) FRET as a function of acceptor concentration for Trk-A in the presence of hß-NGF. (B) Trk-A-mTurquoise (donor) concentration versus Trk-A-eYFP (acceptor) concentration in the presence of hß-NGF. (C) Fraction of dimers as a function of total receptor concentration for Trk-A, Trk-B and Trk-C in the presence of hß-NGF, h-BDNF and hNT-3, respectively. (D) Histogram of Trk-A Intrinsic FRET values in the presence of hß-NGF. (E) Histogram of Trk-B Intrinsic FRET values in the presence of h-BDNF. (F) Histogram of Trk-C Intrinsic FRET values in the presence of hNT-3. The dimerization parameters for the three receptors in the presence of ligands are reported in Table 1.

