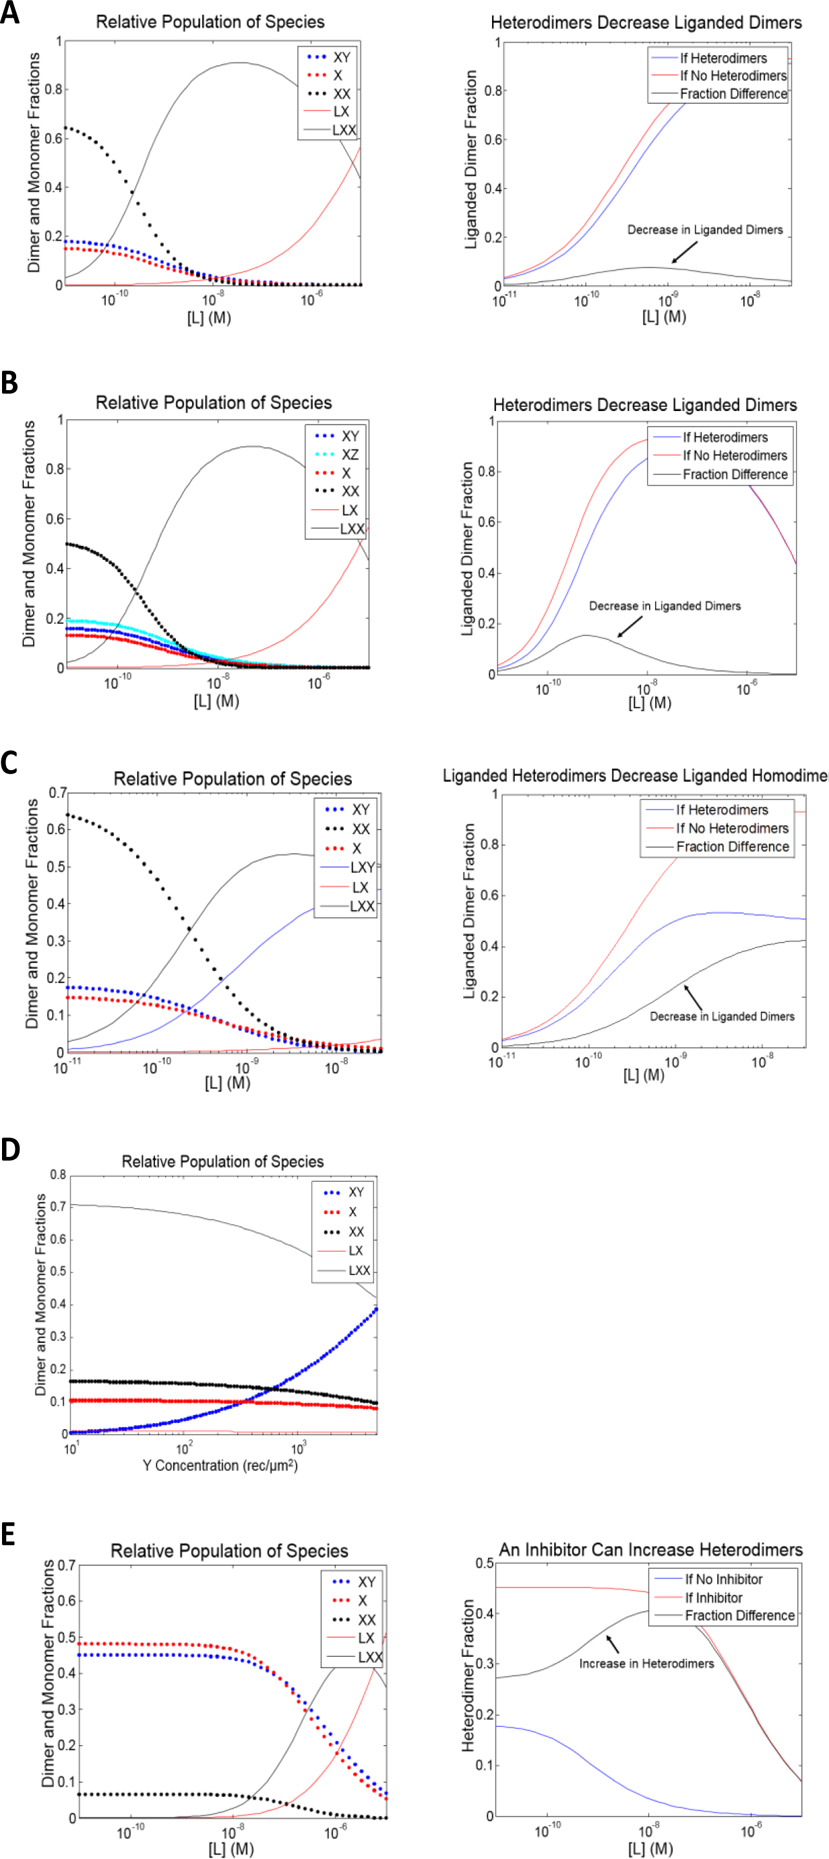
Figure 4.

Predictions based on the thermodynamic cycles in Figure 3, produced with MATLAB. These predictions can help explain many of the complicated biological effects which have been described in the literature (see the “Overview of Known RTK Cross-Subfamily Hetero-Interactions” section). All receptors are assumed to have concentrations of 500 rec/μm2 unless otherwise stated. Values of the constants used in the predictions are estimates for VEGFR2 dimerization; VEGFA binding to VEGFR2; EGFR dimerization; and in the case of 4B, EphA2 dimerization. The K’s (receptor-receptor interactions) and L’s (ligand-receptor interactions) are association constants in units of μm2/rec and M−1, respectively. (A) A prediction based on the thermodynamic cycle in Figure 3D: KX = .029 μm2/rec, KY = .0088 μm2/rec, KXY = .0094 μm2/rec, L1 = 9.6*107 M−1, and L2 = 4.3*109 M−1. The left plot shows the different dimeric and monomeric fractions as a function of ligand concentration. The right plot compares the fraction of X receptors which exist as liganded dimers, for the case modeled in the left plot (blue), and for the case where X and Y cannot heterodimerize (red), as a function of ligand concentration. The black curve is the difference between the red and the blue curves, and it depicts the decrease in liganded dimers due to the presence of heterodimers. (B) A prediction based on the thermodynamic cycle in Figure 3E: KX = .029 μm2/rec, KY = .0088 μm2/rec, KZ = .0049 μm2/rec, KXY = .0094 μm2/rec, KXZ = .0092 μm2/rec, L1 = 9.6*107 M−1, and L2 = 4.3*109 M−1. The left plot shows the different dimeric and monomeric fractions as a function of ligand concentration. The right plot compares the fraction of X receptors which exist as liganded dimers, for the case modeled in the left plot (blue), and for the case where the heterodimers XY and XZ cannot form (red), as a function of ligand concentration. The black curve is the difference between the red and the blue curves, and it depicts the decrease in liganded dimers due to the presence of heterodimers. (C) A prediction based on the thermodynamic cycle in Figure 3F: KX = .029 μm2/rec, KY = .0088 μm2/rec, KXY = .0094 μm2/rec, LX1 = 9.6*107 M−1, and LX2 = 4.3*109 M−1, LY1 = 9.6*106 M−1, LY2 = 4.3*108 M−1, and LXY = 4.3*109 M−1. The left plot shows the different dimeric and monomeric fractions as a function of ligand concentration. The right plot compares the fraction of X receptors which exist as liganded dimers, for the case modeled in the left plot (blue), and for the case where X and Y do not form heterodimers (red), as a function of ligand concentration. The black curve is the difference between the red and the blue curves, and it depicts the decrease in liganded dimers due to the presence of heterodimers. (D) A prediction based on the thermodynamic cycle in Figure 3D, which shows the different dimeric and monomeric fractions as a function of Y concentration for a fixed X concentration: the concentration of X is 250 rec/μm2, the concentration of L is 1 nM, KX = .029 μm2/rec, KY = .0088 μm2/rec, KXY = .0094 μm2/rec, L1 = 9.6*107 M−1, and L2 = 4.3*109 M−1. The concentration of liganded homodimers decreases and the concentration of the heterodimers increases as the concentration of Y increases. (E) A prediction based on the thermodynamic cycle in Figure 3D, which models the effect of an inhibitor of homodimerization by assuming that the homodimerization constant of the RTK which binds ligand, X, and the ligand binding constants are reduced one hundred-fold: KX = .00029 μm2/rec, KY = .0088 μm2/rec, KXY = .0094 μm2/rec, L1 = 9.6*105 M−1, and L2 = 4.3*107 M−1. These decreases mimic the effect of a targeted inhibitor which decreases the ability of an RTK to form homodimers and to bind ligand. The left plot shows the different dimeric and monomeric fractions as a function of ligand concentration. The right plot shows the difference between the fraction of X receptors which is in a heterodimer in the “no inhibitor case,” depicted in blue (identical conditions to Figure 4A) and in the case when the inhibitor is present (modeled on the left), depicted in red. The black curve is the difference between the red and the blue curves, and it shows a large increase in heterodimers in the inhibitor case.
