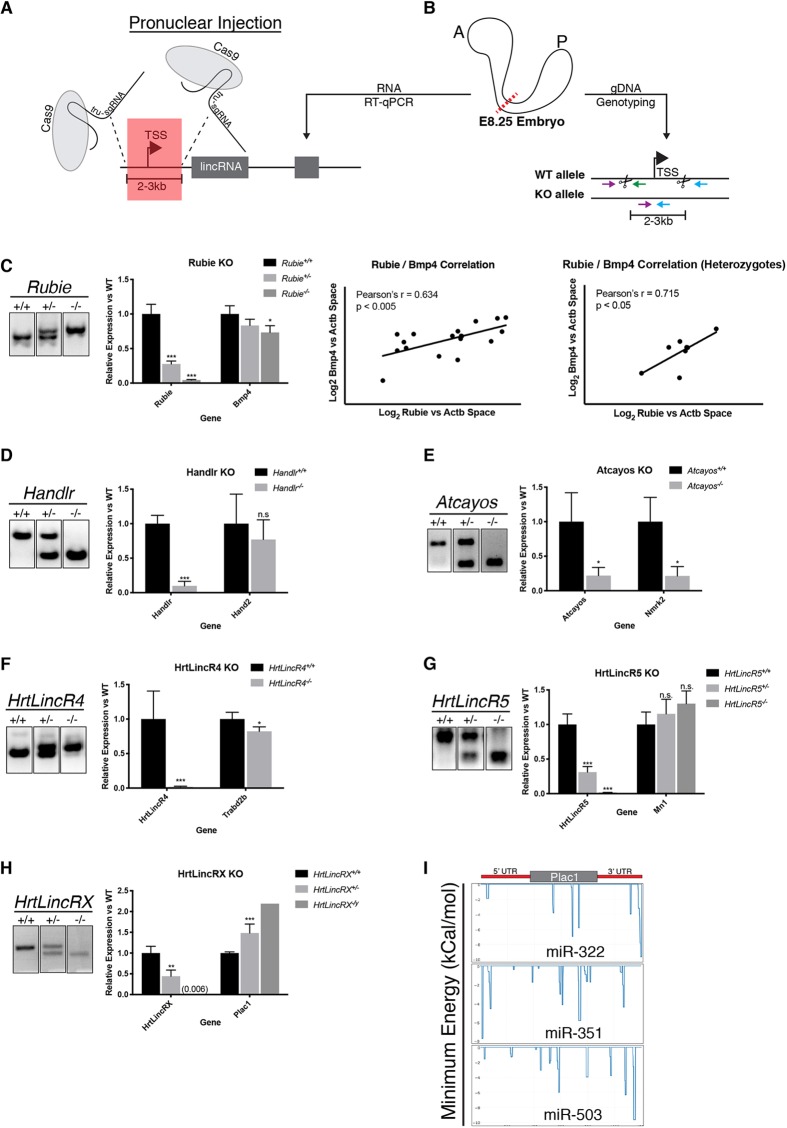
Fig. 4.
Cas9 ablation of cardiac lincRNAs in vivo and effects on local gene expression. (A) lincRNA TSS/promoter ablation strategy. TSS, transcriptional start site; tru-sgRNA, truncated single guide RNA. (B) Schematic for RT-qPCR on the anterior half of an E8.25 embryo and gDNA genotyping on the posterior half of the embryo. A, anterior; P, posterior; dotted red line indicates a bisection point; colored arrows indicate the orientation of genotyping primers; scissors, Cas9 cut sites. (C) Left: electrophoresed gDNA PCR genotyping products of Rubie alleles and quantification of the resulting Rubie and Bmp4 expression in anterior E8.25 embryos. Right: correlation between Rubie expression and Bmp4 expression for all genotypes or Rubie+/− only. (D) Electrophoresed gDNA PCR genotyping products of Handlr alleles and quantification of the resulting Handlr and Hand2 expression in anterior E8.25 embryos. (E) Electrophoresed gDNA PCR genotyping products of Atcayos alleles and quantification of the resulting Atcayos and Nmrk2 expression in anterior E8.25 embryo. (F) Electrophoresed gDNA PCR genotyping products of HrtLincR4 alleles and quantification of the resulting HrtLincR5 and Mn1 expression in anterior E8.25 embryos. (G) Electrophoresed gDNA PCR genotyping products of HrtLincR5 alleles and quantification of the resulting HrtLincR4 and Trabd2b expression in anterior E8.25 embryos. (H) Left: electrophoresed gDNA PCR genotyping products of HrtLincRX alleles and quantification of the resulting HrtLincRX and Plac1 expression in anterior E8.25 embryos. (I) IntaRNA 2.0 binding prediction between HrtLincRX 3′ miRNAs and Plac1. *P<0.05; **P<0.01; ***P<0.005; n.s., not significant; Student's two-tailed t-test. Data are mean±s.e.m. in C-H.

