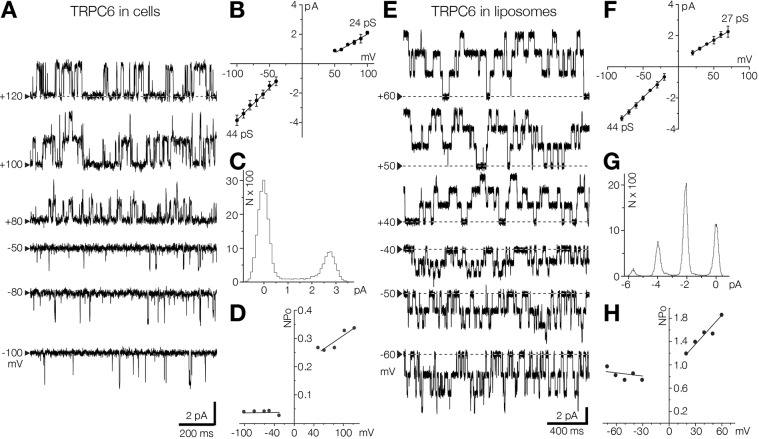
Fig. 4.
Unidirectional incorporation of TRPC6 ion channel into the liposomal bilayer. (A) Representative hTRPC6 single-channel recording at different voltages in inside-out patches from HEK293T cells. Black arrowheads indicate the position of the baseline current. Upward and downward single-channel deflections represent outward and inward current, respectively. (B) Current-voltage relationship for single TRPC6 channels in inside-out patch mode (n=6) from HEK293T cells. The single-channel conductance values are shown on the plot for inward (bottom left) and outward (top right) current: 44.6±4.7 pS and 24.1±3.1 pS respectively. (C) Amplitude histogram corresponding to the channel activity shown in A at +120 mV. (D) Open probability (NPo) of TRPC6 channel related to the patch voltages (mV) recorded in HEK293T cells. (E) Spontaneous activity of the Δ94 mTRPC6 channel in liposomes recorded at different voltages in the excised patch. Black arrowheads indicate the position of the baseline current. (F) Current voltage relationship of mTRPC6 recorded in liposomes with linear fitting (n=5). Single-channel conductance values for inward and outward are 44.5±0.6 pS (bottom left) and 27.7±2.7 pS (top right), respectively. (G) Amplitude histogram corresponding to the channel activity shown in E, at −50 mV. (H) The relationship between voltage (mV) and open probability (NPo) of the TRPC6 recorded in liposomes. Other denotations are as in Fig. 1.

