Fig. 4.
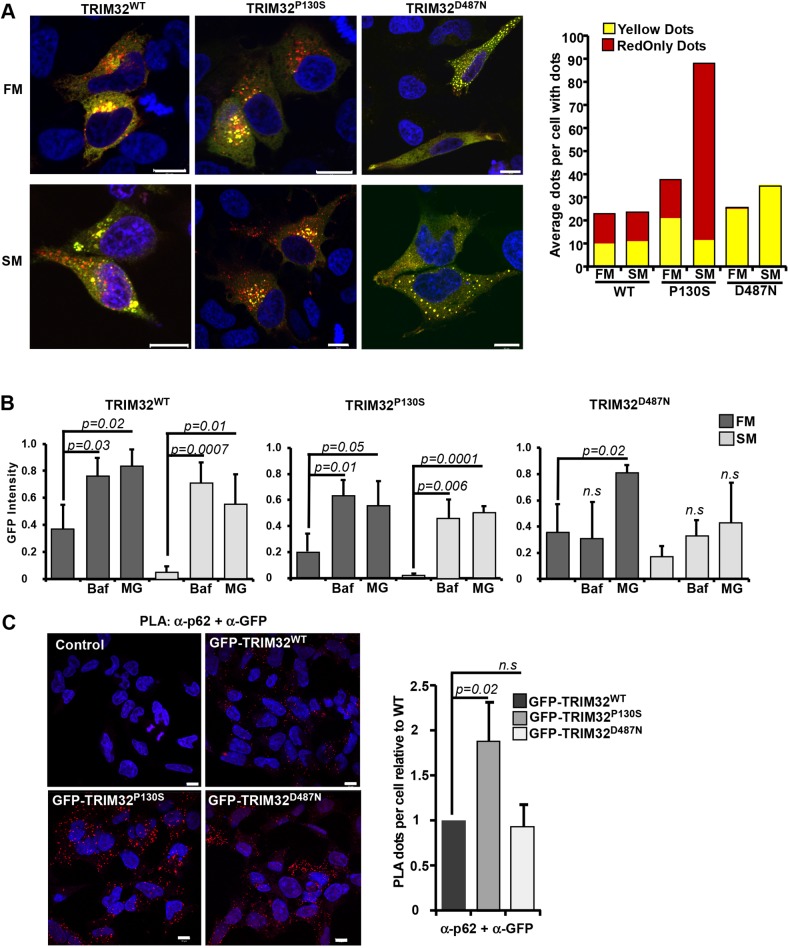
The LGMD2H disease mutant of TRIM32 is not degraded by autophagy. (A) HeLa cells were transfected with mCherry–EYFP–TRIM32WT, mCherry–EYFP–TRIM32P130S or mCherry–EYFP–TRIM32D487N as indicated, kept in normal medium (full medium, FM) or starved with HBSS for 2 h (starvation medium, SM) at 1 day post transfection and imaged by a Zeiss780 confocal microscope. The graphs to the right display manual quantification of RedOnly dots and yellow dots in n=30 cells, and are representative of three independent experiments. Scale bars: 10 µm. (B) GFP fluorescence intensities (arbitrary units) of EGFP–TRIM32WT, EGFP–TRIM32P130S and EGFP–TRIM32D487N as measured by flow cytometry 24 h after promoter shut off in full medium (FM) or HBSS for 6 h (SM), supplemented with BafA1 2 µm (Baf) or MG132 20 µM (MG) as indicated. Bars show average mean±s.d. GFP intensity from three independent experiments (n=10,000 cells). P-values are as indicated; n.s., not significant (Student's t-test). (C) Representative images of the Flp-In EGFP-TRIM32 cells analyzed by the proximation ligation assay DuoLink using antibodies against GFP and p62. The graph represents the mean±s.d. relative number of colocalization dots with from three independent experiments. Each experiment includes z-stack images of n≈100 cells per condition, and was quantified using the Volocity software. P-values are as indicated; n.s., not significant (Student's t-test). Scale bars: 10 µm.

