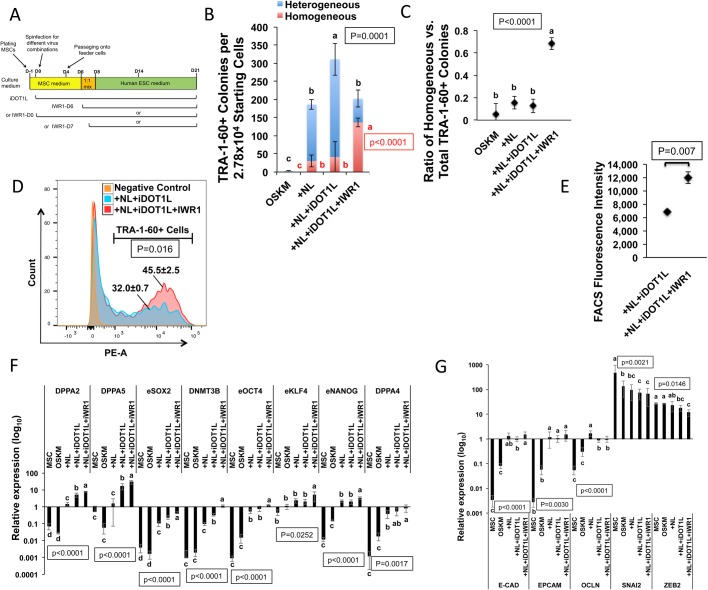
Fig. 4.
Effects of inhibiting H3K79 methylation and the WNT signaling pathway on reprogramming. (A) Schematic diagram showing the timeline of iDOT1L and IWR1 administration in reprogramming. (B) Numbers of homogeneous (red), heterogeneous (blue) and total (red plus blue) TRA-1-60+ colonies in the OSKM condition and the other reprogramming conditions on day 12. +NL, +NL+iDOT1L and +NL+iDOT1L+IWR1 represent the addition of NL alone or NL plus inhibitor(s) to OSKM for reprogramming. Bars represent the mean±s.d., n=3. Letters and P-values shown in red and black represent the statistics for the numbers of homogeneous and total TRA-1-60+ colonies, respectively. (C) Ratio of homogeneous versus total TRA-1-60+ colonies in the OSKM condition and the other reprogramming conditions as indicated in B on day 12. Scatter plots represent the mean±s.d., n=3. (D) FACS analysis of cellular TRA-1-60 immunofluorescence on reprogramming day 14 with or without WNT inhibition. The percentage of TRA-1-60+ cells out of the total reprogrammed cells is shown as the mean±s.d., n=3. (E) Median fluorescence intensity of TRA-1-60+ cells as determined by FACS analysis on reprogramming day 14 with or without WNT inhibition. Scatter plots represent the mean±s.d., n=3. (F) qRT-PCR results of pluripotent marker gene expression in MSCs and reprogrammed cells on day 14 under the conditions described in B relative to H9-ESC expression. Bars represent the mean±s.d., n=3. (G) qRT-PCR results of epithelial and mesenchymal gene expression in MSCs and reprogrammed cells on day 14 under the conditions described in B relative to H9-ESC expression. Bars represent the mean±s.d., n=3. In all graphs, conditions with different letters are significantly different.

