Fig. 4.
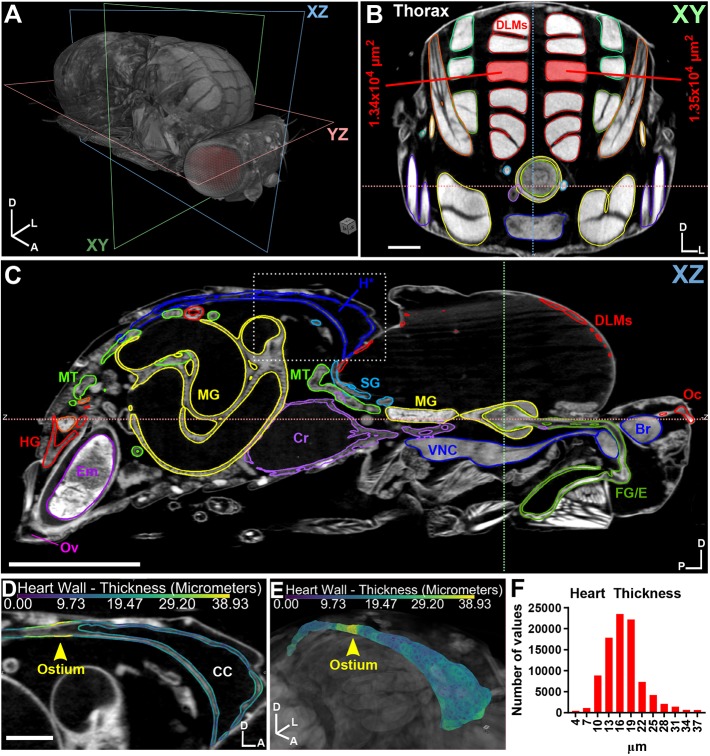
µ-CT of adult Drosophila melanogaster highlighting muscle and heart tissue. (A) 3D representation of an adult female fly with the body axis (A, anterior; D, dorsal; L, left) and imaging planes (xy, xz, yz) denoted. (B) 2D xy anterior view of the thorax revealing muscles. A pair of dorsal longitudinal muscles (DLMs) are highlighted and the cross-sectional area is measured. Other muscle groups (red, green, orange, yellow and blue), gut (yellow), salivary glands (aqua blue) and crop (purple) are also shown. (C) xz view; organs are segmented by color. Br, brain; Cr, crop; DLMs, dorsal longitudinal muscles; Em, embryo; FG/E, foregut/esophagus; H, heart; HG, hindgut; MG, midgut; MT, Malpighian tubule; Oc, ocelli; Ov, ovipositor; SG, salivary gland; VNC, ventral nerve cord. (D) Close up of the boxed region in C revealing the heart. Heart wall thickness (µm) is indicated by color code (see Materials and Methods). Position of an ostium is shown (arrowhead). CC, conical chamber. (E) 3D representation of the heart, colored by thickness (µm). (F) Histogram of heart thickness values. Body axes are indicated: A, anterior; D, dorsal; L, left; P, posterior. Scale bars: 100 µm (B,D); 500 µm (C). Stained with 0.1 N iodine and scanned in slow mode at an image pixel size of 1.25 µm.

