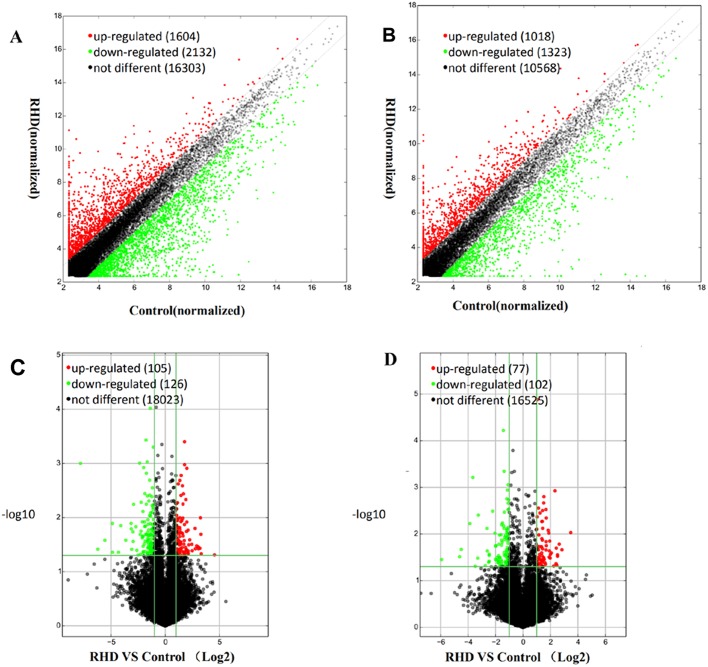
Fig. 2.
Expression profiles of lncRNAs and mRNAs in circulating exosomes. The scatterplots showed the profile of lncRNAs (A) and mRNAs (B). The volcano plot showed the profile of lncRNAs (C) and mRNAs (D). Red dots represent differentially upregulated expression and blue dots represent differentially downregulated expression (fold change≥2.0, P≤0.05, two-tailed t-test), while black dots indicate no difference.

