Fig. 3.
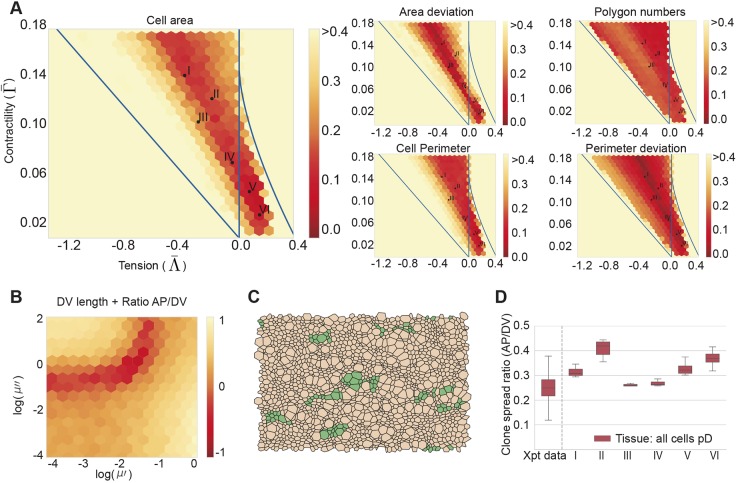
Identification of simulation parameters matching experimentally determined features of the neuroepithelium. (A) Similarity of experimental data and simulations with the indicated composite tension and contractility parameters. Colour code represents the average of the maximum distance of the empirical cumulative distribution function for cell area, cell perimeter and polygon number, and the absolute difference between the standard deviations of cell area and cell perimeter (see Materials and Methods). Experimental data is from E11.5 embryos and simulations correspond to 10 independent simulations per point in parameter space. Roman numbered dots indicate the mechanical parameters selected to study clonal distribution, (Λ̄, Γ̅): I, (−0.4, 0.14); II, (−0.2, 0.12); III, (−0.3, 0.1); IV, (−0.05, 0.065); V, (0.075, 0.04); VI, (0.15, 0.02). μ′ and μ″ are 0.02 and 1, respectively. Blue lines demarcate the four different parameter regions of the phase diagram (see Supplementary Materials and Methods, section II). (B) Heatmap as in A, but the absolute value of the difference (log scale) in the change in DV length of the tissue over 48 h plus the absolute value of the difference in the final tissue aspect ratio (AP/DV) between simulations and experimental data was taken and this quantity was averaged over 10 simulations for each point. (Λ̄, Γ̅) used for these simulations are from the mechanical parameter set V. (C) Examples of the shape of simulated clones tracked over 48 h demonstrate the DV bias in their elongation in silico. Brown represents pD cells, green represents clones of pD cells. (D) Comparison of clone spread ratio (AP/DV) between experiments (Xpt data) and simulations. Box plot shows the quartiles of 12 realisations of the simulation with no differentiation (all cells pD domain); median values (middle bars) and interquartile ranges (boxes); whiskers extend from the box to show the range of the data 1.5x the interquartile range past the first and third quartiles. Roman numerals indicate mechanical parameters used (Λ̄, Γ̅) in A. Other parameter values are provided in Table 2.

