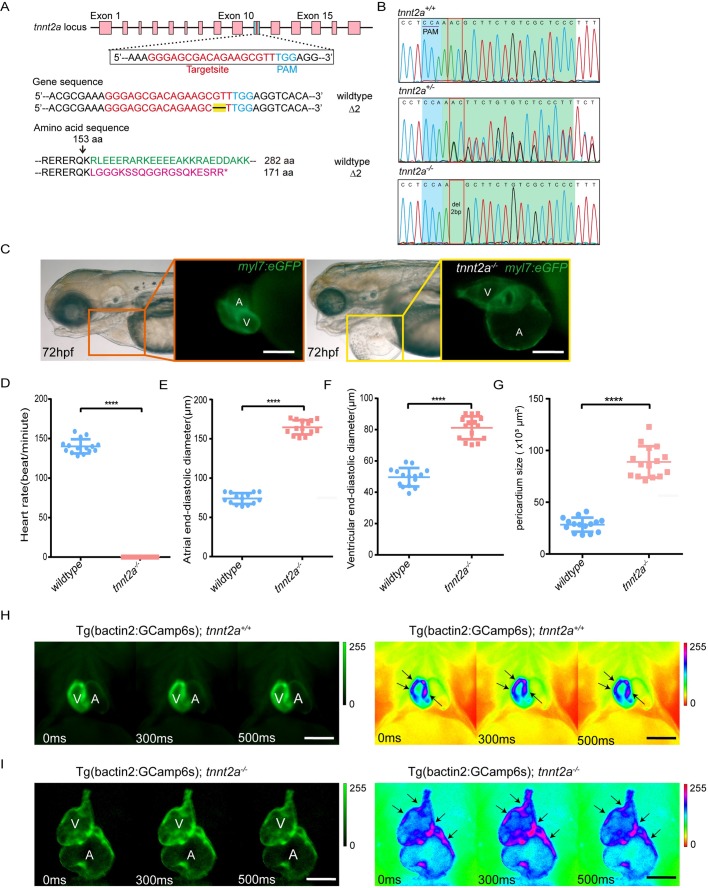
Fig. 1.
Generation of tnnt2a mutant zebrafish and phenotype analyses. (A) Graphical representation of the target site of tnnt2a for CRISPR/Cas9 gRNA and altered amino acid sequence of Tnnt2a of mutant zebrafish. (B) Genotype sequencing results of tnnt2a+/+ and tnnt2a−/− zebrafish. (C) Representative images of atrial (A) and ventricular (V) enlargement, and pericardial effusion in 72 hpf tnnt2a−/− zebrafish. Scale bars: 150 µm. (D–G) Statistics for the heart rate, atrial and ventricular diameter, and pericardium size in wild-type and tnnt2a−/− zebrafish; ****P<0.0001; n=15 per group. Statistical differences were evaluated using two-tailed unpaired t-tests (D–F) or unpaired t-test with Welch's correction (G). (H,I) Fluorescent images and pseudo-colours of electrocardiac rhythm in Tg(bactin2:GCamp6s; tnnt2a+/+) and Tg(bactin2:GCamp6s; tnnt2a−/−) zebrafish; arrows represent increased Ca2+ flux in cardiomyocytes. The direction of Ca2+ flux was from venous to arterial end both in tnnt2a+/+ and tnnt2a−/−. Scale bars: 100 µm.

