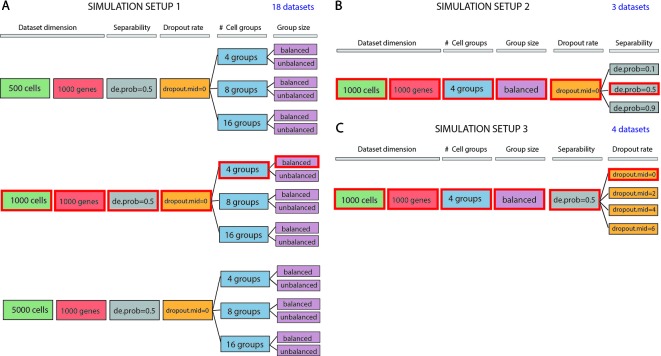
Figure 1.
Data simulation scheme. (A) Simulation of 18 datasets using Setup 1. Simulated datasets are of various dimensions (number of cells), number of cell groups and proportion of cells within each group (balance or unbalance group sizes). (B) Simulation of 3 datasets using Setup 2. Simulated datasets vary in terms of separability between the groups (from poorly to well separable). This feature has been controlled by setting the de.prob parameter of Splatter simulation function to three values: 0.1, 0.5 and 0.9. (C) Simulation of 4 datasets using Setup 3. In this simulation setup, we used one dataset to create 3 others by placing an increasing number of zeros (controlled by dropout.mid parameter) on the count matrix. We highlighted by red color three identical datasets across all simulated setups. Each simulation setup has been repeated with 5 different values of the seed.

