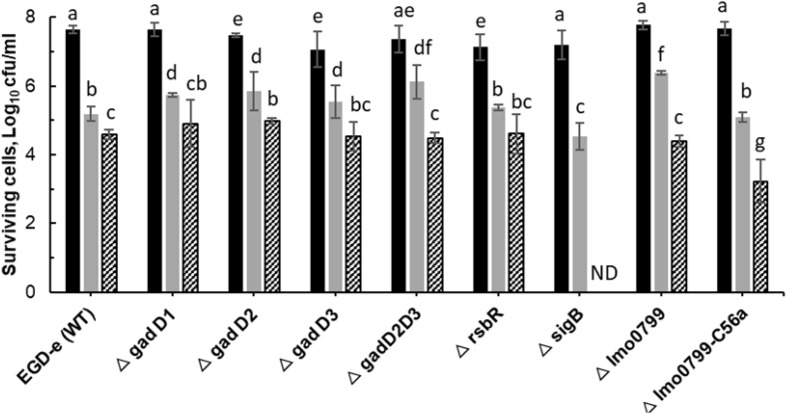
FIGURE 3.
Effect of ACP on L. monocytogenes EGD-e wild type and its knockout mutant strains. The graph displays surviving population of L. monocytogenes after ACP treatment at variable time range ( , untreated control;
  , 1 min;
  , 3 min) and 1 h of post treatment storage time. ND, Non-detectable (below detection limit of 1.0 Log10 CFU/ml). Vertical bars indicate standard deviation. Column with different letters indicate a significant difference between bacterial strains and treatment time (p < 0.05).

