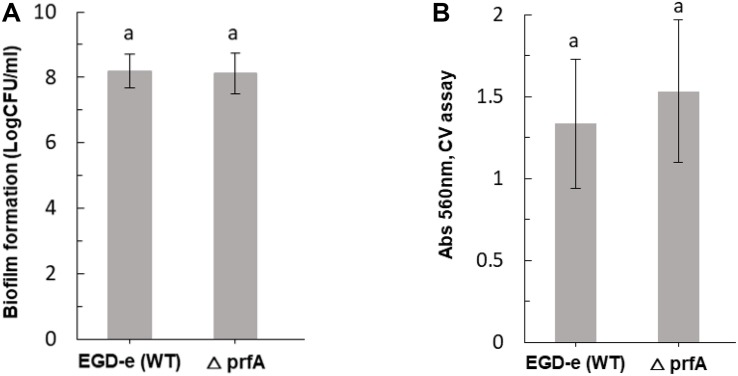
FIGURE 6.
Impact of prfA on biofilm formation. Biofilm formation by L. monocytogenes EGD-e (WT) and △prfA mutant at 37°C in TSB for 48 h, quantified by (A) plate count and (B) crystal violet assay. Vertical bars indicate standard deviation. Column with different letters indicate a significant difference between EGD-e (WT) and prfA (p < 0.05).

