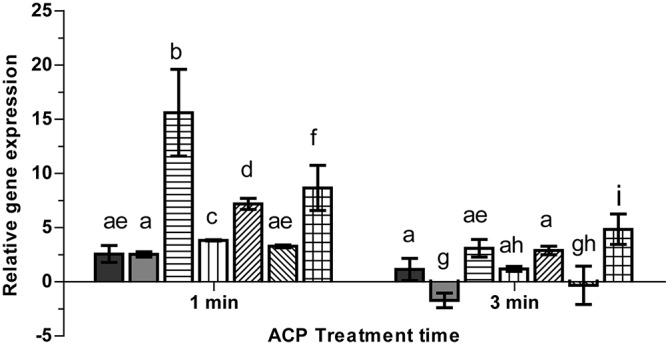
FIGURE 8.

Effect of ACP on gene expression of stress related genes in L. monocytogenes EGD-e (WT).  , rsbR;
 , prfA;
 , sigB;
  , gadD1;
  , gadD2;
  , gadD3;
  , lmo0799. The y-axis represents the Log2 fold change between untreated cells and ACP treatment cells (for 1 min or 5 min), determined by the delta-delta CT method. Vertical bars represent standard deviation in the mean of two independent repeats. Column with different letters indicate a significant difference between bacterial strains and treatment time (p < 0.05).
