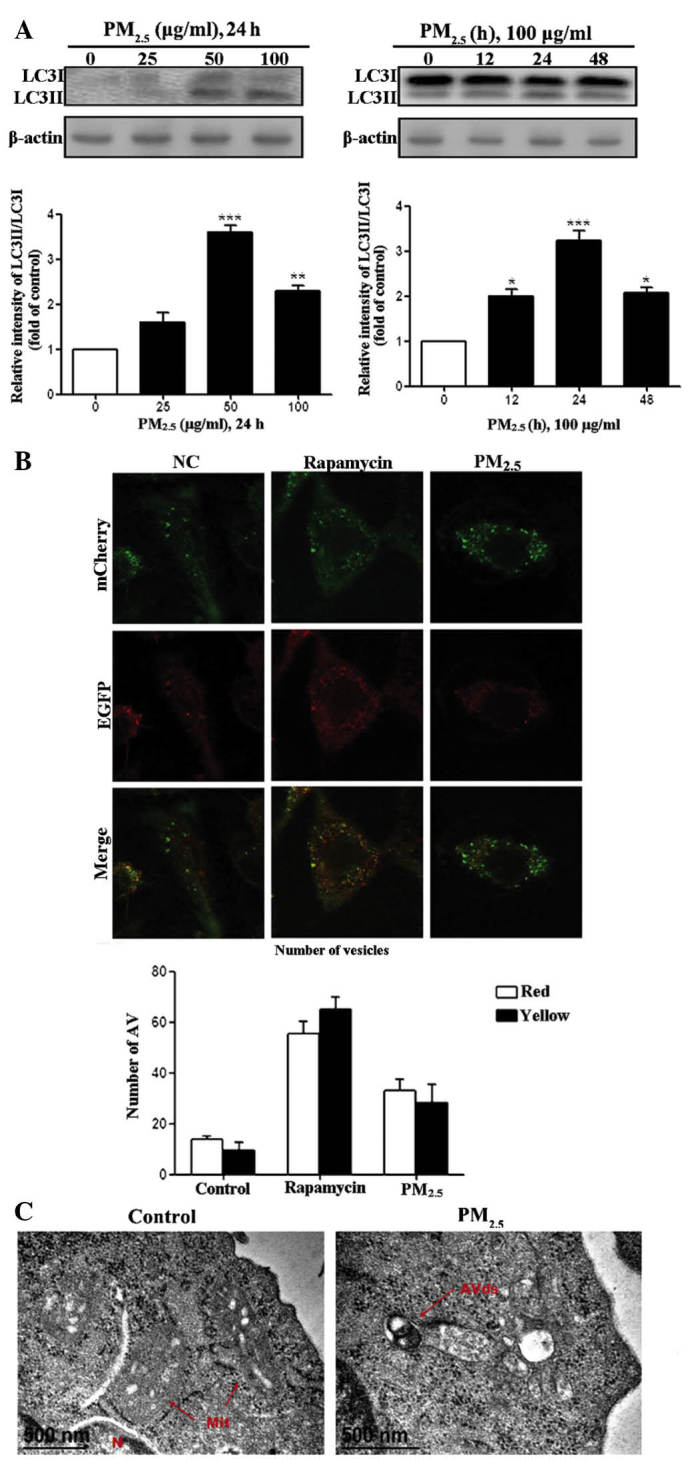
Figure 1.

Autophagy is induced in Beas-2B cells following exposure to PM2.5. (A) Beas-2B human bronchial epithelial cells were treated with the indicated concentrations of PM2.5 for 24 h or with 100 µg/ml PM2.5 for the indicated time-periods. Cell lysates were subjected to immunoblot analysis for detection of LC3 levels and β-actin was used as loading control. Quantification of the results are presented as the amount of LC3II normalized against LC3I. (B) Beas-2B cells were transfected with mCherry-eGFP-LC3 and treated with 100 µg/ml PM2.5 for 24 h. Beas-2B cells were treated with phosphate-buffered saline and rapamycin as negative and positive controls, respectively. Cells were examined by fluorescent microscopy, and representative cells were selected and photographed. (C) PM2.5 induced ultrastructural features of autophagy. Beas-2B cells were treated with 100 µg/ml PM2.5 for 24 h and processed for electron microscopy. Note the double membrane structure of the autophagic vacuoles. Degrading autophagic vacuoles (AVds) are indicated. Scale bar, 500 nm. Values are expressed as the mean ± standard deviation of three independent experiments. *P<0.05, **P<0.01 and ***P<0.001 vs. control. All above experiments were repeated three times. PM2.5, particle matter 2.5; LC3, microtubule-associated protein 1 light chain 3; NC, normal control; N, nucleus; Mit, mitochondria; eGFP, enhanced green fluorescent protein; AV, autophagic vesicles.
