Figure 1.
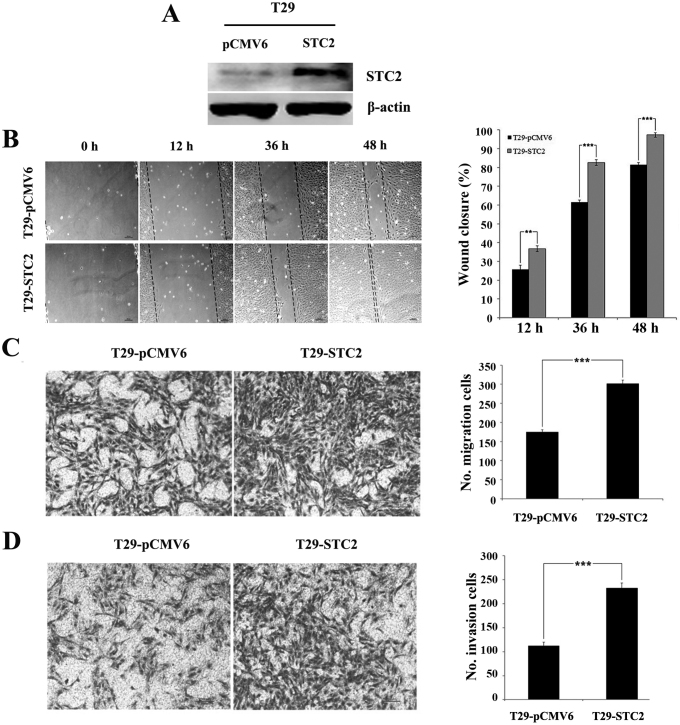
STC2 overexpression significantly promotes cell migration and invasion in T29 cells. (A) STC2 protein levels in T29-pCMV6 and T29-STC2 stable cell lines are shown by western blot analysis. (B) Representative images of T29-pCMV6 and T29-STC2 cells at 0, 12, 36 and 48 h post-scratch at ×100 magnification (left panel). The bar graph shows the mean ± SD (percent of wound closure) of three idnependent experiments with five fields measured per experiment (right panel). (C) In the Transwell migration and (D) Matrigel invasion assays, images of T29-pCMV6 and T29-STC2 cells that had (C) migrated or (D) invaded to the lower chamber were captured at ×100 magnification (left panel). The bar graph shows the quantification of the cell migration (right panel). **P<0.01; ***P<0.001. STC2, stanniocalcin 2.

