Figure 4.
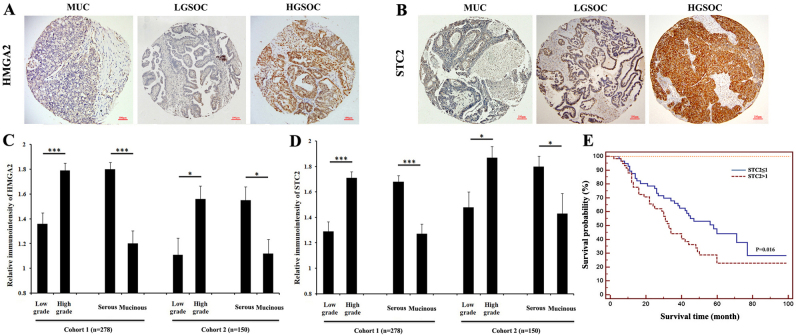
STC2 expression correlates with tumor grade, tumor histotype and correlates with a poor overall survival in EOC. Photomicrographs show some examples of immunoreactivity for (A) HMGA2 and (B) STC2 in mucinous (MUC), low-grade serous (LGSC) and high-grade serous carcinoma (HGSC). Histograms show the average immunoreactivity for (C) HMGA2 and (D) STC2 in association with tumor grade (left) and histotype (right) in the two cohorts. *P<0.05; ***P<0.001. (E) Kaplan-Meier curves of STC2 expression and overall survival in 95 advanced ovarian cancer patients. STC2, stanniocalcin 2; EOC, epithelial ovarian cancer; HMGA2, high-mobility gene group A2.

