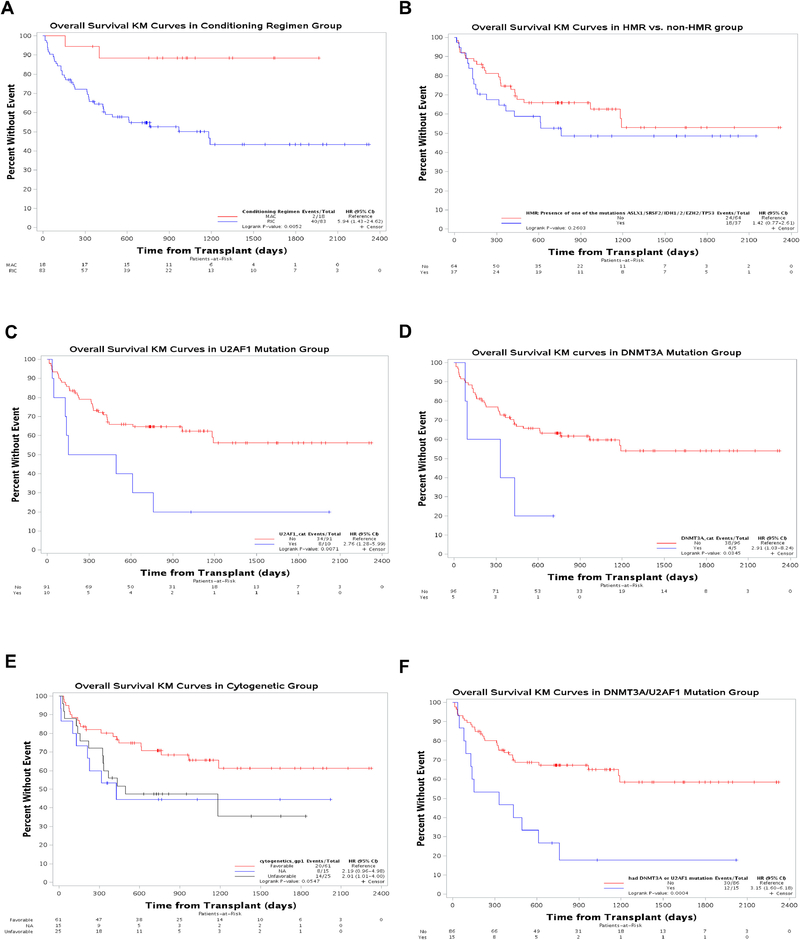
Figure 3: Kaplan-Meier curves for overall survival (OS) by conditioning intensity, mutations and cytogenetic abnormalities.
OS (A) compared between myeloablative conditioning (MAC) and reduced intensity conditioning (RIC), (B) Presence or absence of high molecular risk (HMR) mutations (C) Presence or absence of U2AF1 mutations (D) Presence or absence of DNMT3A mutations (E) Favorable and unfavorable cytogenetic abnormalities and (F) The combined effect of conditioning intensity and presence or absence of U2AF1 and DNMT3A mutations.

