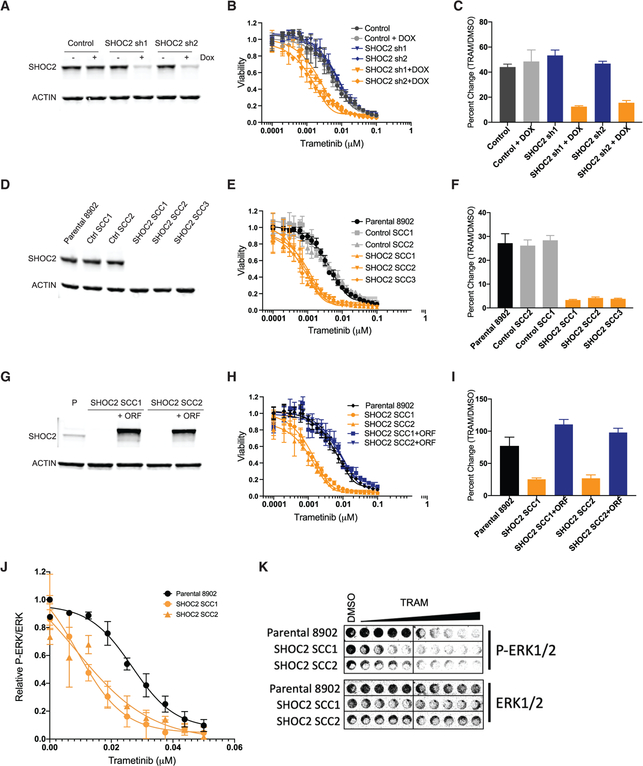
Figure 3. SHOC2 Depletion Sensitizes to MEK Inhibition.
(A) SHOC2 protein levels in PA-TU-8902 stable cell lines infected with SHOC2 doxycycline-inducible shRNA or control shRNA after 72 h of doxycycline (Dox) treatment.
(B) Proliferation assay of PA-TU-8902 cells after 6 days of trametinib treatment as measured by Cell-Titer-Glo (CTG).
(C) Quantification of clonogenic assay by crystal violet staining for each condition relative to cells expressing control shRNA treated with DMSO control (9 days of treatment).
(D) SHOC2 protein levels in single-cell clones with CRISPR-Cas9 KO of SHOC2.
(E) Proliferation assay of PA-TU-8902 cells after 6 days of trametinib treatment as measured by CTG.
(F) Quantification of clonogenic assay by crystal violet staining for each condition relative to cells expressing control shRNA treated with DMSO control (9 days of treatment).
(G) Western blot for SHOC2 protein expression in single-cell clones with or without introduction of a SHOC2-expressing open reading frame (ORF) cDNA.
(H) 6-day CTG proliferation assay in cells that express the SHOC2 ORF cDNA showing rescue of trametinib sensitivity.
(I) Clonogenic assay quantification in single-cell clones with or without expression of the SHOC2 ORF cDNA. Bars represent the average of three independent replicates ± SD.
(J) In-cell western quantification of relative p-ERK to total ERK at various doses of trametinib 48 h post-treatment, normalized to DMSO control.
(K) Representative in-cell western image.

