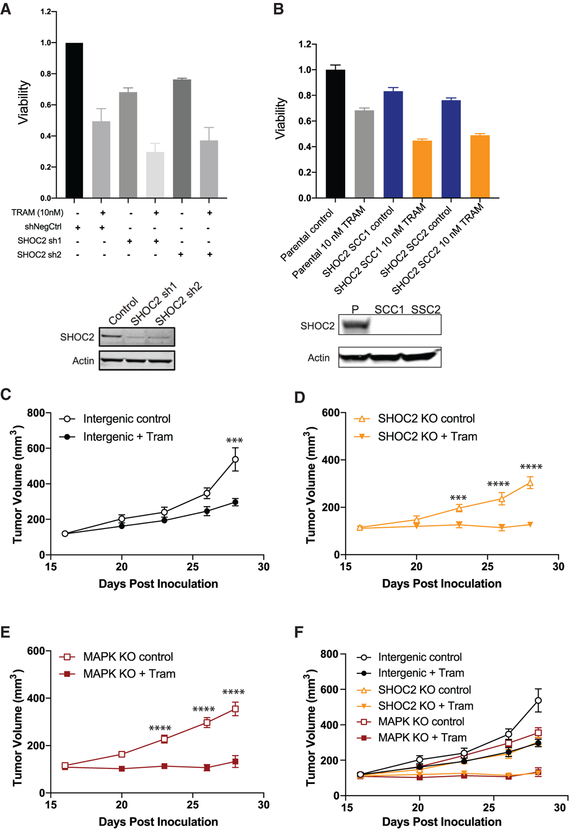
Figure 5. Impact of SHOC2 Suppression in Combination with MEKi on Proliferation in Three-Dimensional Culture and In Vivo Tumor Growth.
(A) Relative short-term viability (CTG) of PA-TU-8902 cells stably expressing control and SHOC2 targeting shRNAs via growth in low-attachment assays in combination with trametinib (10 nM) treatment for 6 days. Immunoblot of SHOC2 expression below. Error bars represent average relative CTG proliferation readings of three biological replicates (n = 3) ± SEM.
(B) Relative viability (CTG three-dimensional) of SHOC2 KO PA-TU-8902 single-cell clones (SCCs) and parental grown in 100% Matrigel domes in combination with trametinib (10 nM) treatment for 7 days. Immunoblot of SHOC2 expression below. Bars represent the average of three independent replicates ± SD.
(C) Tumor volume (mm3) growth kinetics of PA-TU-8902 sgRNA intergenic control cells subcutaneously injected (3 × 10⁶) in SHO-immunocompromised mice treated with or without trametinib.
(D) Tumor volume growth kinetics of PA-TU-8902 SHOC2 KO cells subcutaneously injected (3 × 10⁶) in SHO mice treated with or without trametinib.
(E) Tumor volume growth kinetics of PA-TU-8902 MAPK1 KO cells subcutaneously injected (3 × 10⁶) in SHO mice treated with or without trametinib.
(F) Combined tumor volume growth kinetics of PA-TU-8902. sgRNA intergenic control, SHOC2 KO, and MAPK1 KO tumors. Statistical significance ***p ≤ 0.001 and ****p ≤ 0.0001, and error bars represent ± SEM.

