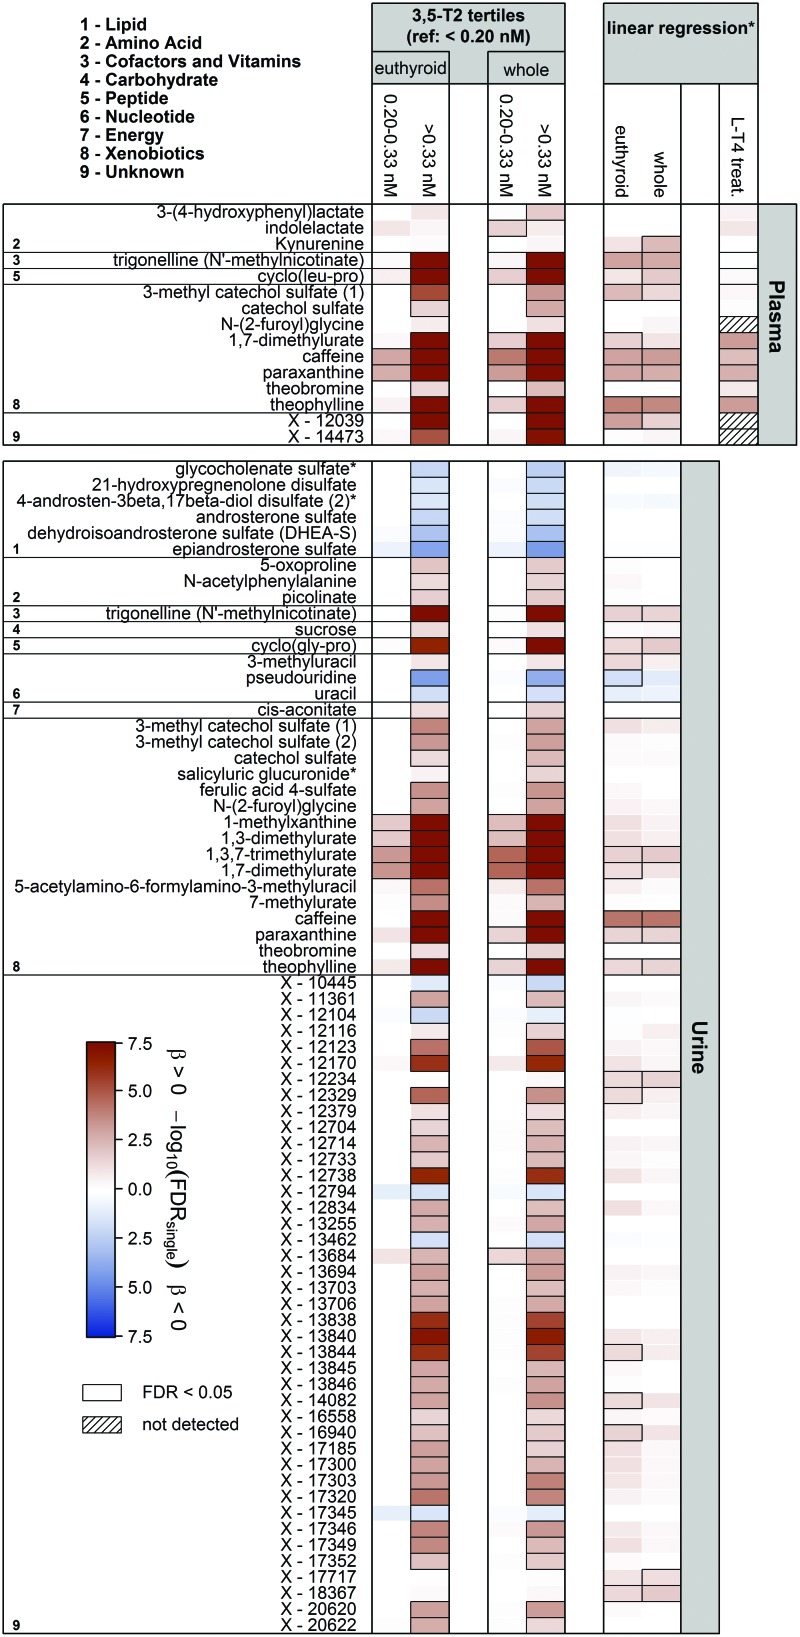
FIG. 2.
Heat map based on corrected p-values (controlling the FDR at 5%) from linear regression analyses using either tertiles of 3,5-diiodothyronine (3,5-T2; <0.20 nM, 0.20–0.33 nM, >0.33 nM) or log(3,5-T2) concentrations as exposure and plasma and urine metabolites as outcome. Models were adjusted for age, sex, waist circumference, time of blood sampling, and thyrotropin and fT4 concentrations. Columns indicate the effect comparing with the lowest 3,5-T2 group or results from linear regression using log(3,5-T2). Orange and blue shadings indicate positive and inverse associations, respectively. Thick frames indicate significant (FDR <0.05) associations. Analyses were performed on the whole sample as well as a euthyroid subsample. LT4 treat = associations between 3,5-T2 and named metabolites in an LT4 challenge; models were adjusted for age, sex, BMI, and fT4 concentrations. Corresponding estimates and FDR values are given in Table 2. *Linear regression analyses were only performed including participants with 3,5-T2 values above 0.20 nM. FDR, false discovery rate; fT4, free thyroxine. Color images are available online.

