Fig. 1.
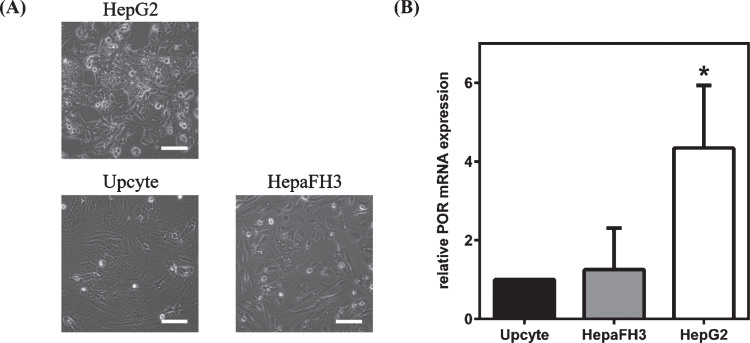
Morphology and POR mRNA expression in HepG2, HepaFH3 and Upcyte® cells. (A) Exponentially growing cells were analysed by phase contrast microscopy. Pictures taken with Olympus CKX41 at 10× primary magnification. Scale bar: 100 μm. (B) POR mRNA expression analysis by qRT-PCR of exponentially growing cell cultures. Data shown as arithmetic mean±standard deviation; *p < 0.05; *significant changes compared to Upcyte cells (n = 9).

