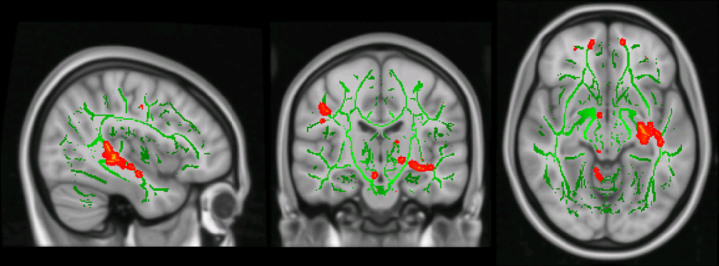
Fig.1.
Differences of mode of anisotropy in SCD cases compared with controls. Projection of the differences of mode of anisotropy values between SCD cases and controls (mode of anisotropy smaller in SCD than in controls) in red to yellow color on the group specific averaged TBSS fiber tract skeleton (green color) in MNI standard space. Effects are thresholded at p < 0.01, uncorrected for multiple comparisons

