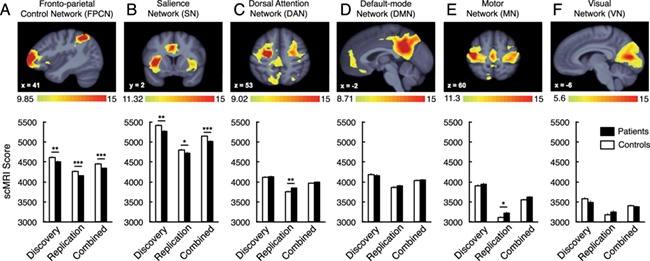
Figure 3.

Composite structural covariance network scores group differences. Composite structural covariance network scores are presented for the discovery, replication and combined samples. Structural covariance network topographies were identified in the Discovery sample (see Figure 1 for whole brain results). Whole-brain structural covariance of the (A) fronto-parietal control network (B) salience network, (C) dorsal attention network, (D) default-mode network (E) motor network, and (F) visual network. *p < .05, **p < .01, ***p < .001. Error bars denote +/− 1 standard error of the mean. The color scale indicates the bootstrap ratio (BSR), equivalent to a z-score.
