. 2019 Dec 13;68(4):1–14. doi: 10.15585/mmwr.rr6804a1

FIGURE.

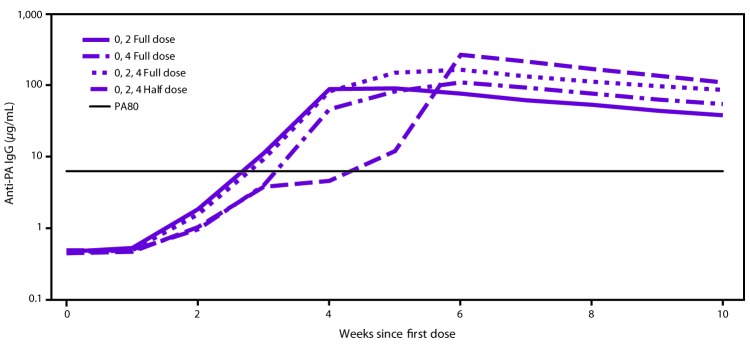
This figure is a line graph showing the group geometric means of anti-protective antigen immunoglobulin G enzyme-linked immunosorbent assay from 0 to 10 weeks since the first dose of anthrax vaccine adsorbed (AVA). The three groups who received an AVA dose at week 2 had higher antibody concentrations at week 4 than the one group who did not. The dose-sparing schedule of 2 full doses administered 4 weeks apart produced the highest antibody concentrations from week 6 onward after the first dose. The 3 full-dose regimen produced higher antibody concentrations than when the vaccine was administered as 3 half doses at all measured time points after week 1. The peak response was measured 2 weeks after the last dose for the licensed and dose-sparing AVA postexposure prophylaxis schedules.

Group geometric means for anti-protective antigen immunoglobulin G enzyme-linked immunosorbent assay over time after administration of anthrax vaccine adsorbed*

Abbreviations: AVA = anthrax vaccine adsorbed; IgG = immunoglobulin G; PA = protective antigen.

* 0, 2 Full dose = 0.5 mL AVA administered at 0 and 2 weeks; 0, 4 Full dose = 0.5 mL AVA administered at 0 and 4 weeks; 0, 2, 4 Full dose = 0.5 mL AVA administered at 0, 2, and 4 weeks; 0, 2, 4 Half dose = 0.25 mL AVA administered at 0, 2, and 4 weeks; PA80 = 80% predicted protection level.