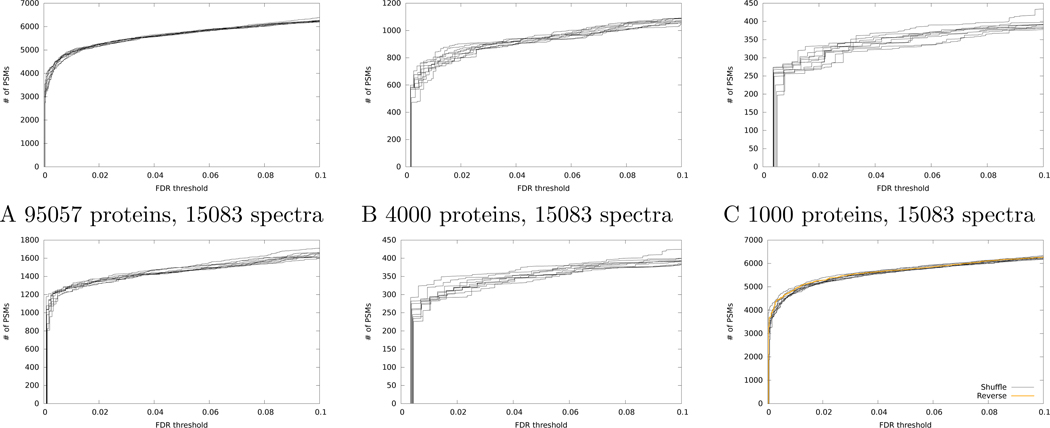
Figure 2: Variation in discoveries from TDC+.
(A) The figure plots the number of accepted PSMs as a function of FDR threshold for the Kim dataset, searched using Tide with the XCorr score function. Results from ten searches against different decoy databases are shown. (B-C) Same as panel A, but after randomly down-sampling the database to contain fewer proteins. (D-E) Same as panel A, but after randomly down-sampling the dataset to contain fewer spectra. (F) Same as panel A, but also including a line corresponding to TDC+ with reversed peptide decoys.

