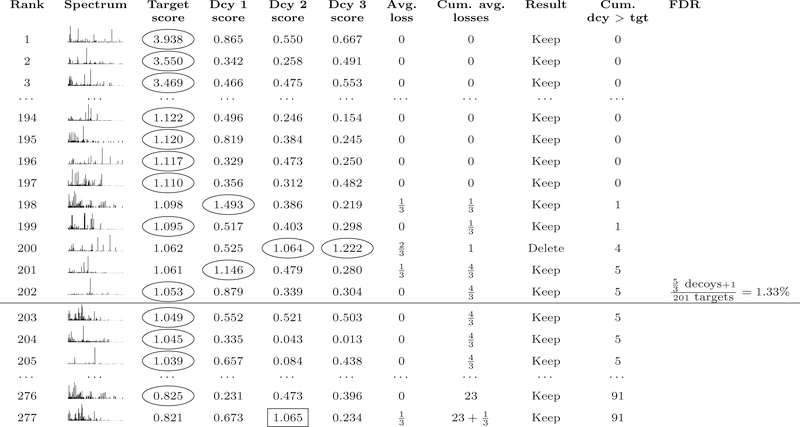
Figure 3: Average target-decoy competition.
The procedure is similar to TDC (Figure 1), except that each target competes against multiple decoys and losses are counted fractionally. A target is eliminated only when the rounded fractional count of losses reaches the next integer value. As in TDC+, FDR for aTDC+ is estimated via Equation 1. Note that decoys for lower-ranking targets that receive high scores (e.g., decoy 2 in line 277) can contribute to the cumulative decoy count for lines above them in the list.

