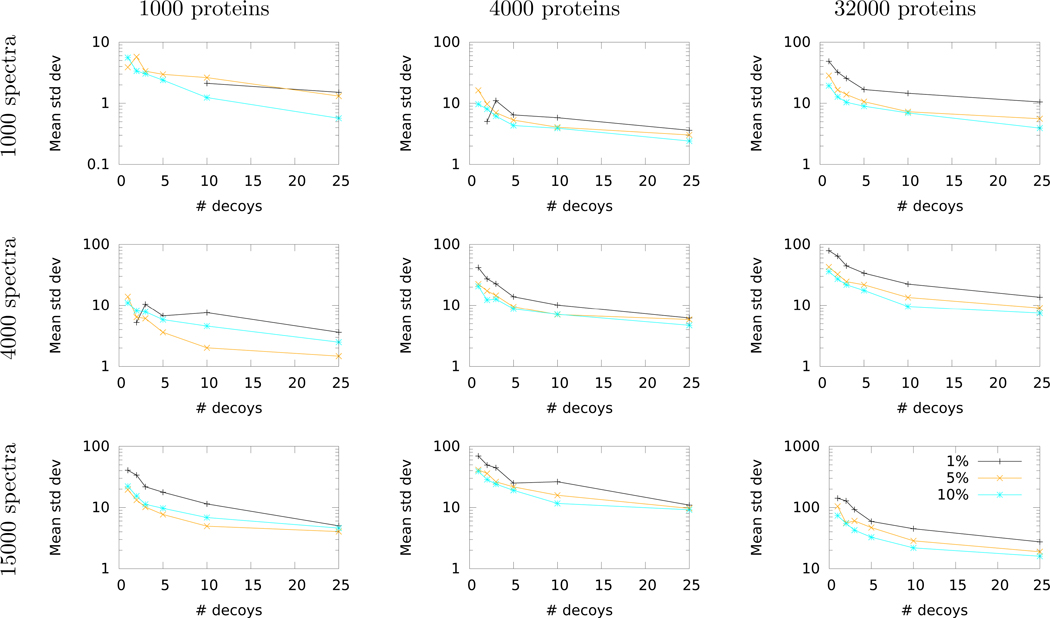
Figure 7: Empirical study of variability of FDR estimates.
Each panel plots the standard deviation in the number of accepted target PSMs, averaged over ten mass spectrometry runs from the Kim dataset, as a function of the number of decoys used for . Each line corresponds to a different FDR threshold. All standard deviations are calculated over ten repetitions of either TDC+ (for 1 decoy) or (for >1 decoy). Missing points correspond to cases that yielded a standard deviation of zero across all ten runs.

