
Fig. 3.
Trends of mean CD4+ at diagnosis by regions (a) Western Europe, (b) Eastern Europe, (c) Latin America and Caribbean, (d) Others.
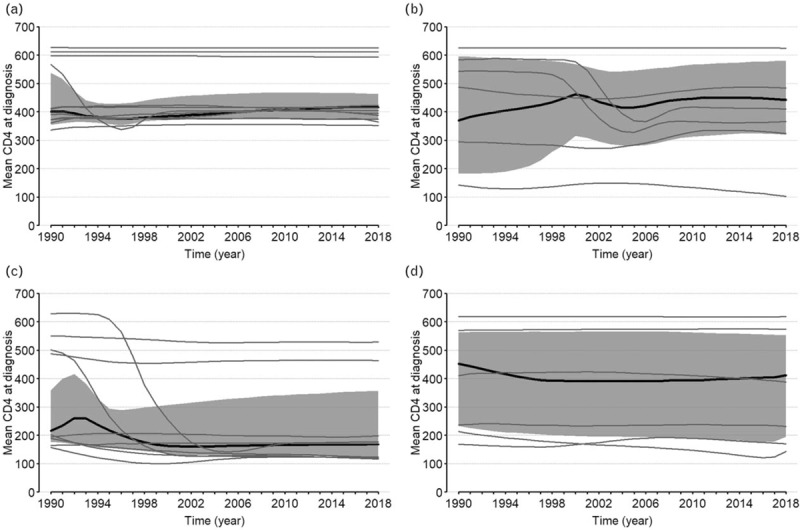
The grey lines represent countries trends, the solid black lines represent the regions’ aggregated medians and their 95 confidence regions obtained using the bootstrap resampling method represented by the greyed areas.