
Fig. 6.
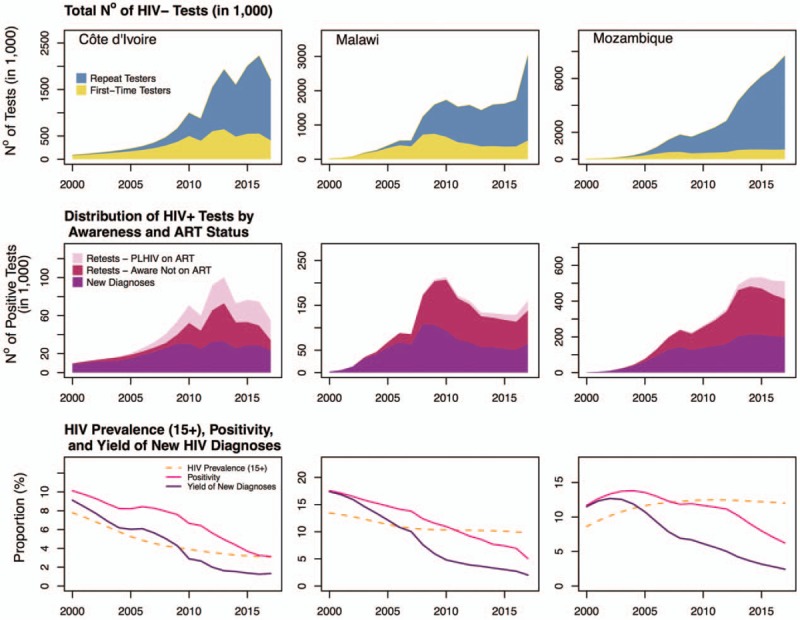
Model predictions of the distribution of the annual total number of HIV-negative tests performed among first-time testers versus repeat testers (top row), distribution of HIV positive tests by awareness status and antiretroviral treatment (ART) status (middle row), and longitudinal trends in HIV testing positivity, yield of new diagnoses, and Spectrum/EPP's estimates of HIV prevalence (aged 15+ years; bottom row); in Côte d’Ivoire (first column), Malawi (second column), and Mozambique (third column).