FIG. 3.
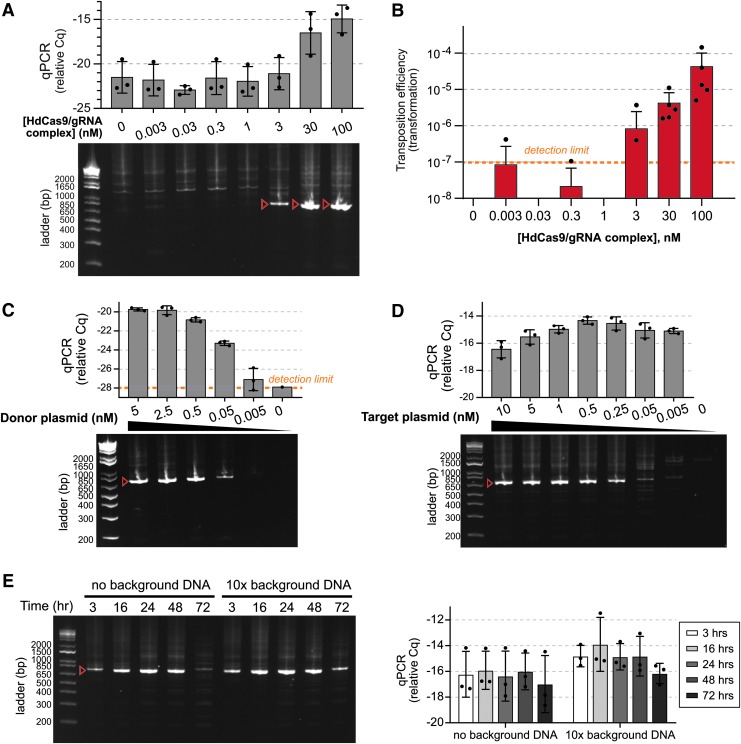
Himar–dCas9-mediated site-directed transposition is robust to changes in ribonucleoprotein complex and DNA concentration. Target plasmids were pGT-B1 and donor plasmids were pHimar6. (A) PCR analysis of transposition reactions (n = 3) using varying levels of Himar–dCas9/gRNA_4 complexes. Reactions were performed for 3 h at 30°C with 5 nM donor and recipient plasmid DNA. (B) Transformation assay to measure transposition rates in reactions using varying levels of Himar–dCas9/gRNA_4 complexes (n = 5). Reactions were performed for 3 h at 30°C with 5 nM of donor and recipient plasmid DNA. (C) PCR analysis of transposition reactions (n = 3) using varying levels of donor plasmid DNA. Reactions were performed for 3 h at 30°C with 5 nM of recipient plasmid DNA and 30 nM Himar–dCas9/gRNA_4 complex. (D) PCR analysis of transposition reactions (n = 3) using varying levels of recipient plasmid DNA. Reactions were performed for 3 h at 30°C with 0.5 nM of donor plasmid DNA and 30 nM Himar–dCas9/gRNA_4 complex. (E) PCR analysis of transposition reactions (n = 3) performed for different lengths of time in the presence or absence of background nonspecific DNA. Reactions were performed at 37°C with 1 nM recipient plasmid DNA, 1 nM donor plasmid DNA, and 100 nM Himar–dCas9/gRNA_4 complex. Background E. coli genomic DNA was present at 10 × the mass of recipient plasmid DNA. (F) Quantitative PCR measurement of transposition efficiency in reactions shown in panel (E). n = 3 for each reaction condition. In all panels, red arrows indicate the expected targeted transposition PCR product for gRNA_4, and error bars indicate standard deviation. Cq measurements correspond to log-scale differences in transposase activity.

