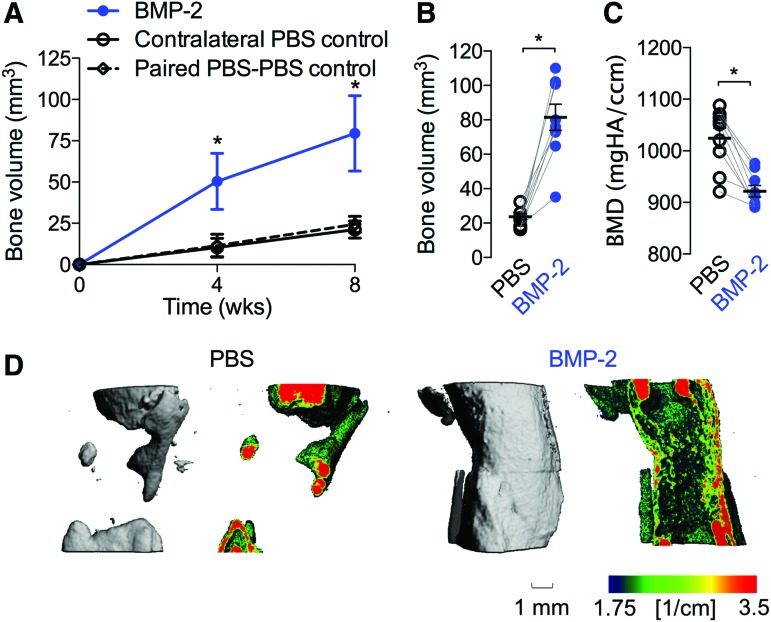
FIG. 3.
Effects of 5 μg BMP-2 delivery on bone formation at week 8. (A) Longitudinal in vivo microCT-measured bone volume. Summary statistics represented as mean ± SEM. (B) Postmortem bone volume at week 8. (C) Postmortem bone mineral density at week 8. (D) Representative microCT images of bone formation and local mineral density mapping. Each replicate is shown with summary statistics represented as mean ± SEM. Comparisons among and between groups were performed by repeated measures or two-way paired ANOVA and Bonnferroni's multiple comparisons test. n = 9 per group, paired PBS–PBS controls, n = 3. *Indicates p ≤ 0.05 versus all other groups at each time point. PBS, phosphate-buffered saline. Color images are available online.

