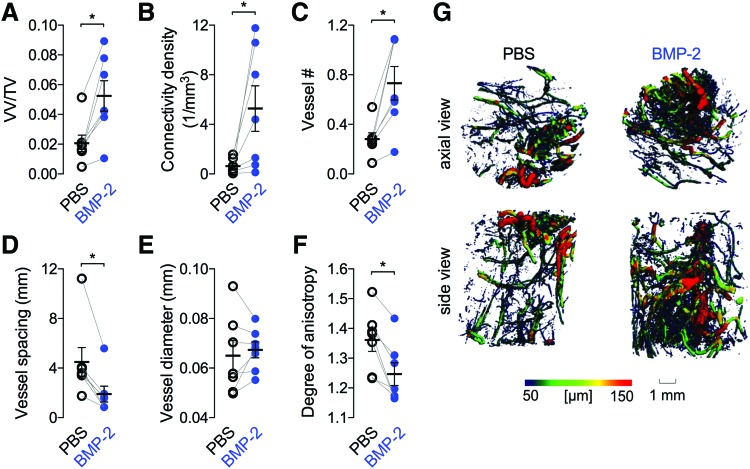
FIG. 4.
Effects of 5 μg BMP-2 delivery on blood vessel formation at 8 weeks. (A) Vessel volume fraction, (B) connectivity density, (C) vessel number, (D) vessel diameter, (E) vessel diameter, (F) degree of anisotropy. Each replicate is shown with summary statistics represented as mean ± SEM. Paired limbs are connected by gray lines and mean values are indicated by the horizontal lines. Comparisons among and between groups were performed by paired Student's t-tests. n = 7–8 per group. (G) Representative microCT images of defect vascularization with local vascular diameter mapping. *p < 0.05. Color images are available online.

