FIG. 6.
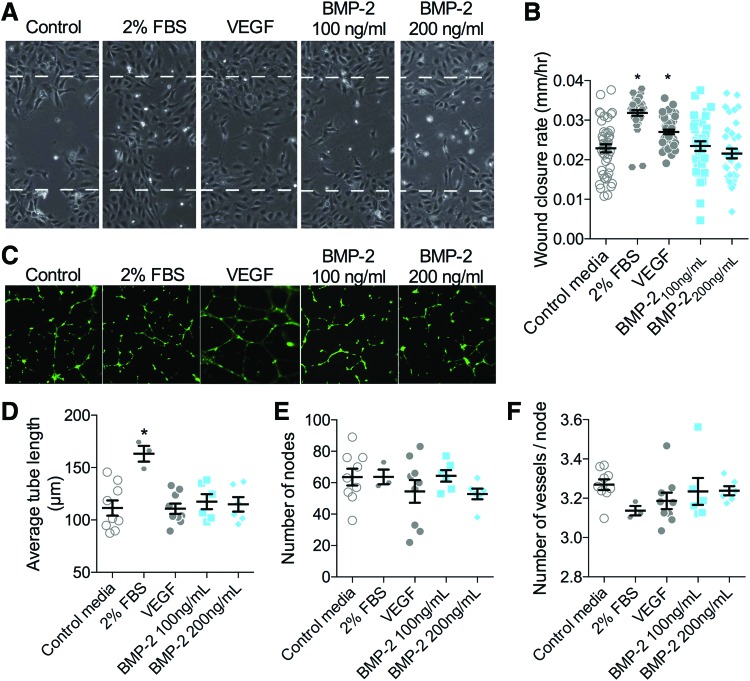
Effects of BMP-2 on endothelial cell migration and tube formation. (A, B) ECFC wound closure was evaluated for 12 h (A) and quantified as wound closure rate (B). All data points are shown with mean and SEM. Initial scratch width indicated by dashed line (450 μm). *Indicates p < 0.05 compared with negative control by Kruskal–Wallis and Dunn's multiple comparisons test. n = 36–44 replicates, in n = 6 independent experiments. (C–F) ECFC tubulogenesis was evaluated for 8 h and visualized by calcein-AM staining (C). Network formation was quantified by average tube length (D), number of nodes (E), and number of vessels per node (F). Each independent replicate is shown with summary statistics represented as mean ± SEM. Initial scratch width indicated by dashed line (450 μm). *Indicates p < 0.05 compared with negative control by ANOVA and Tukey's multiple comparisons test. n = 3–9. Color images are available online.

