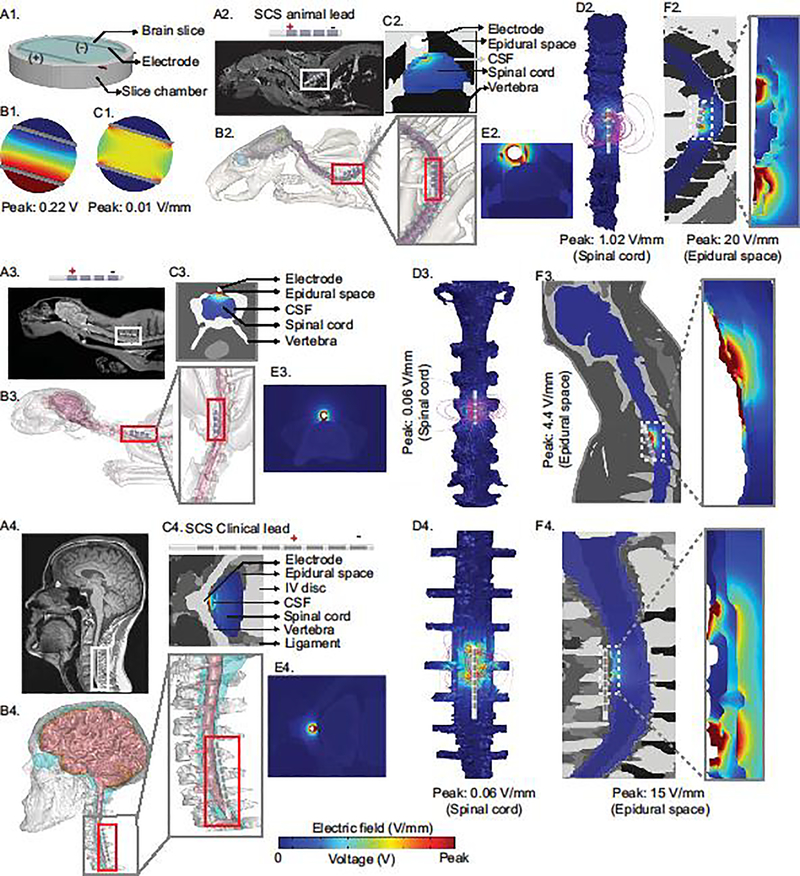
Figure 1: Evaluation of the quasi-uniform assumption for SCS including brain slice, rat, cat, human, and clinical current flow simulation.
We developed computer-aided design (CAD) model of a slice chamber, and a realistic MRI driven computational models of rat, cat, and human and predicted electric field and voltage across tissue. (A1) illustrates brain slice chamber with two parallel stimulating wires. (B1, C1) corresponding predicted peak voltage (0.22 V) and electric field intensity (0.01 V/mm) for the brain slice chamber in A1. (A2) MRI slice of a rat image with a SCS lead positioned epidurally along the lower cervical region. Segmented spinal cord tissues of the rat model (B2). (C2, D2) Cross-section view of predicted electric field and electric field streamlines plotted around the stimulating electrode contacts. (E2, F2) shows predicted peak electric field around the lead (epidural space: 20 V/mm) and the spinal cord (1.02 V/mm) respectively. (A3, B3, C3, D3, E3, F3) illustrates SCS lead positioning, segmentation, and electric field prediction in a cat FEM model. (A4) represents SCS lead positioning at the cervical vertebrae of a human FEM model. (B4) represents spinal cord tissue segmentation. (C4, E4) shows electric field distribution across spinal tissues. (D4) illustrates uniformly seeded electric field streamlines from the leads to the spinal cord (peak: 0.06 V/mm). (F4) represents predicted electric field in the epidural space (peak: 15 V/mm) and other peripheral spinal tissues. The key take-away of these predictions is not simply that peak electric field varies across species but that the spatial distribution of the electric field is complex and species specific, such that the electric field across species can only be matched in a selected ROI, not across all the spinal cord.

